Figure 3. ROS levels in iHTM cells after exposure to tBHP with or without pretreatment with SB203580. The ROS levels of the SB203580(-) cells and SB203580(+) cells increased 53.47±1.75
and 52.64±2.32 folds after tBHP exposure for 1 h. Those of the SB203580(-) cells and SB203580(+) cells increased 111.81±4.33 and 130.48±4.21 folds after
tBHP exposure for 2 h. The data were presented as mean±SD, n=4, p>0.05. Data were expressed as a fold change in ROS production
of the cells. ROS level in iHTM cells without tBHP and SB203580 was set as 1.
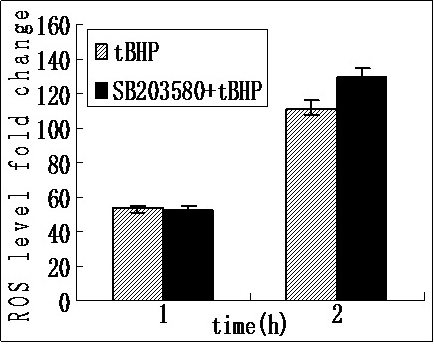
 Figure 3 of
Yang, Mol Vis 2012; 18:2127-2136.
Figure 3 of
Yang, Mol Vis 2012; 18:2127-2136.