Figure 2. LG histology in the control
and aged groups. Control (A) and aged (B) samples
stained with H&E (Scale bar=100 µm). Unstained samples of
control (C) and aged (D), to demonstrate
autofluorescence of LG (white arrows: lipofucsin-like deposits;
Scale bar=100 µm). TEM (Scale bar=2.5 µm) of control (E)
and aged (F) samples revealing details of LG acinar
cells.
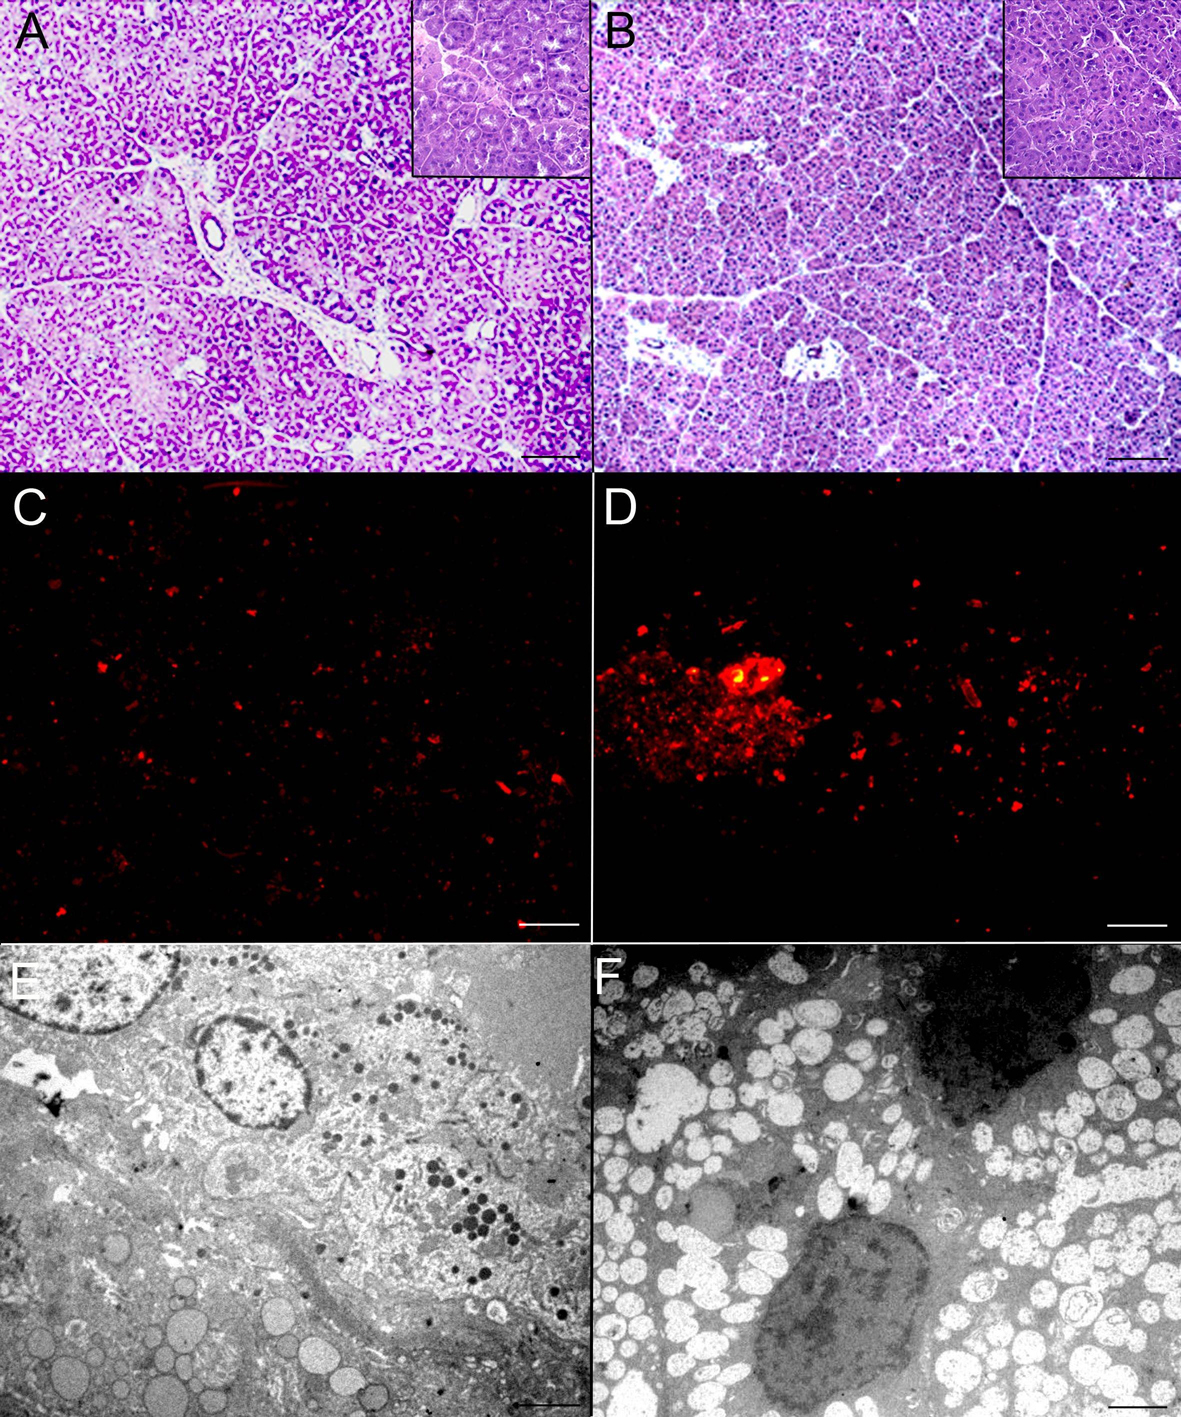
 Figure 2
of Batista, Mol Vis 2012; 18:194-202.
Figure 2
of Batista, Mol Vis 2012; 18:194-202.