Figure 3. Semi-quantitative reverse
transcription -PCR analysis of plasma membrane calcium ATPase 1
(PMCA1) mRNA in rat lenses visualized on an ethidium
bromide-stained agarose gel alongside mRNA of β-actin (ACTB).
A: M- 100 bp DNA ladder; GI- Group I (Normal); GII- Group
II (Selenite-challenged, cataract-untreated); GIII- Group III
(Selenite-challenged, acetyl-L-carnitine -treated). B:
The results depicted are normalized to levels of ACTB.
Data are mean value (experiments run in triplicate) of ratios of
intensity for gene of interest divided by that for ACTB.
aGroup I versus Group II & III values
(p<0.05); bGroup II versus Group III values
(p<0.05).
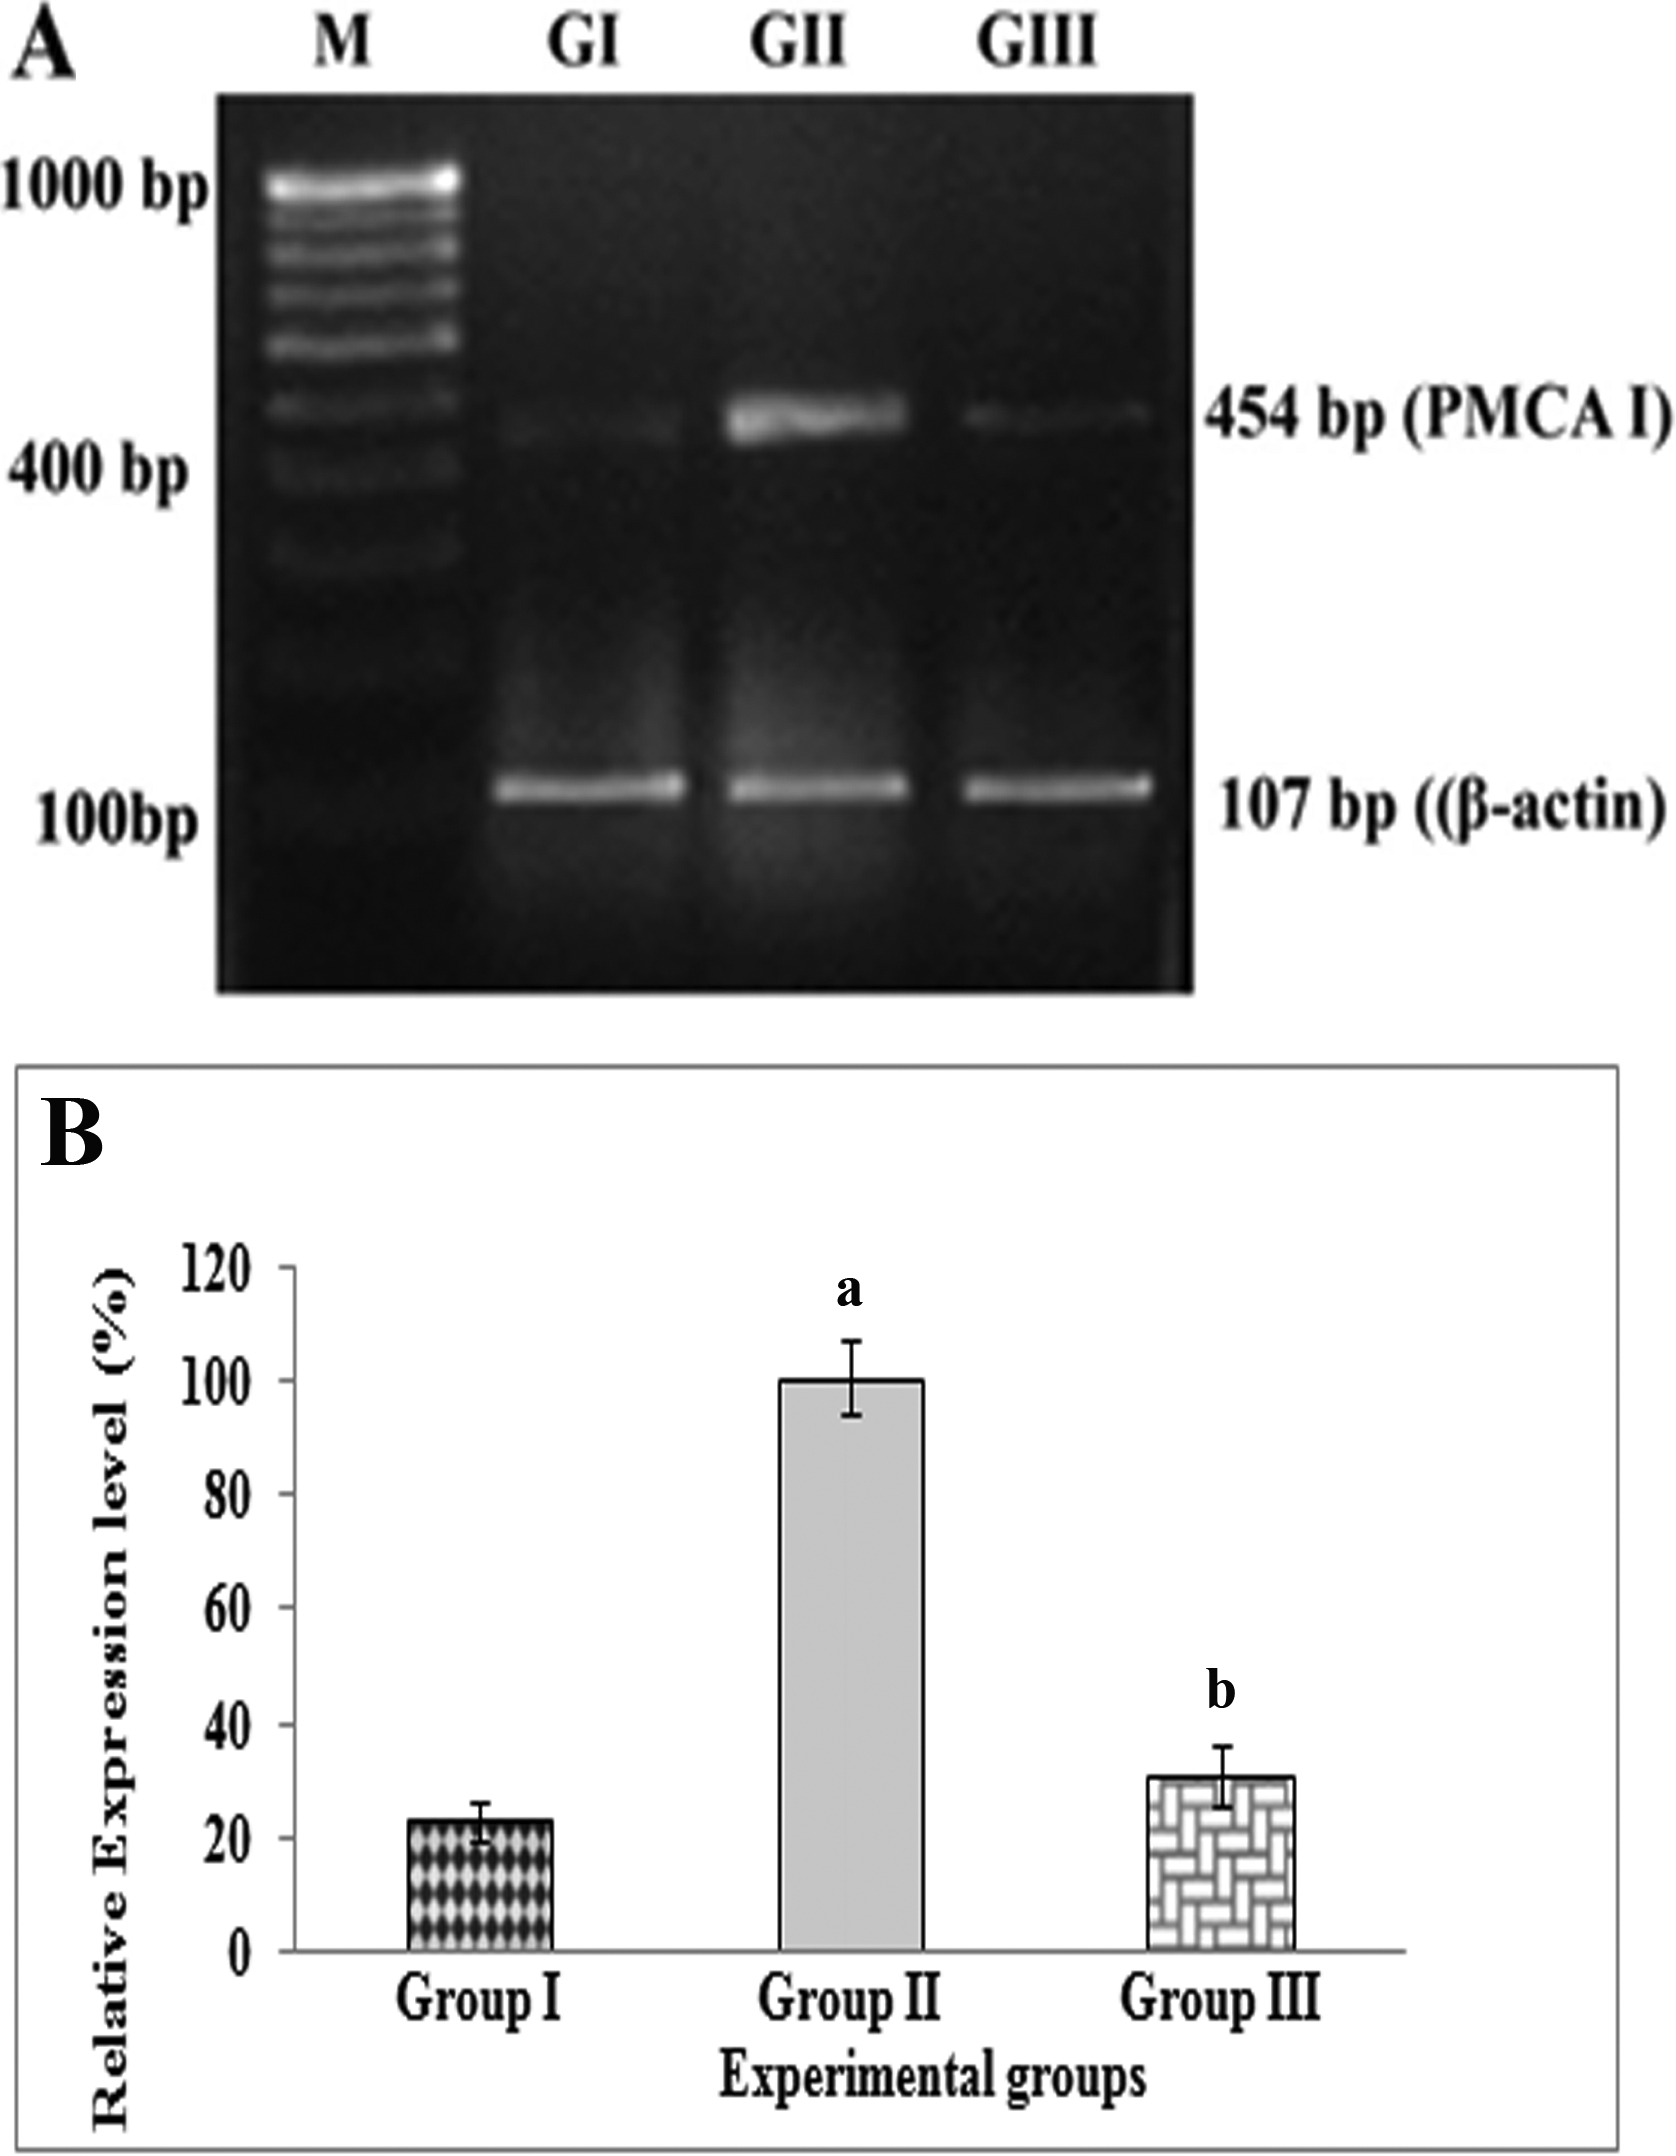
 Figure 3
of Muralidharan, Mol Vis 2012; 18:2076-2086.
Figure 3
of Muralidharan, Mol Vis 2012; 18:2076-2086.