Figure 1. Semi-quantitative reverse transcription-PCR analysis of connexin 46 mRNA in rat lenses visualized on an ethidium bromide-stained
agarose gel alongside mRNA of β-actin (ACTB). A: M- 100 bp DNA ladder; GI- Group I (Normal); GII- Group II (Selenite-challenged, cataract-untreated); GIII- Group III (Selenite-challenged,
acetyl-L-carnitine-treated). B: The results depicted are normalized to levels of β-actin gene. Data are mean value (experiments run in triplicate) of ratios
of intensity for gene of interest divided by that for β-actin. aGroup I versus Group II & III values (p<0.05); bGroup II versus Group III values (p<0.05).
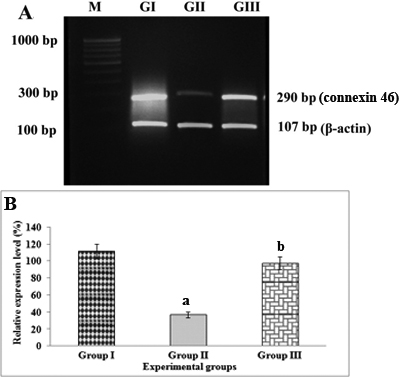
 Figure 1 of
Muralidharan, Mol Vis 2012; 18:2076-2086.
Figure 1 of
Muralidharan, Mol Vis 2012; 18:2076-2086.