Figure 3. The inhibitory effects of
the lenti-LEP503-HSV-tk/GCV system on HLECs. A:
The transcriptional detection of HSV-tk mRNA driven by
lenti-LEP503-HSV-tk-EGFP vector in Hela cells (left) and
HLECs (right). ACTB (590 bp) was used as the internal
control. B: Semi-quantitative analysis for the RT–PCR
results (n=3). The intensities of HSV-tk mRNA were
normalized to ACTB (n=3). C, D: Cell
survival analysis by EGFP expression in HLECs 24 h after
infection, followed 48 h by vehicle control treatment (C)
and by GCV treatment (D). Scale bar: 100 μm. E:
Cell survival analysis after exposure to a series of dose of GCV
with MTT assay (n=5). F: The time-effect curve of the
lenti-LEP503-HSV-tk/GCV system on HLECs and Hela cells
with the CCK-8 assay (n=4). * p<0.05 and *** p<0.001,
compared with Hela cell group (B), vehicle control (0; E)
and control time point (F).
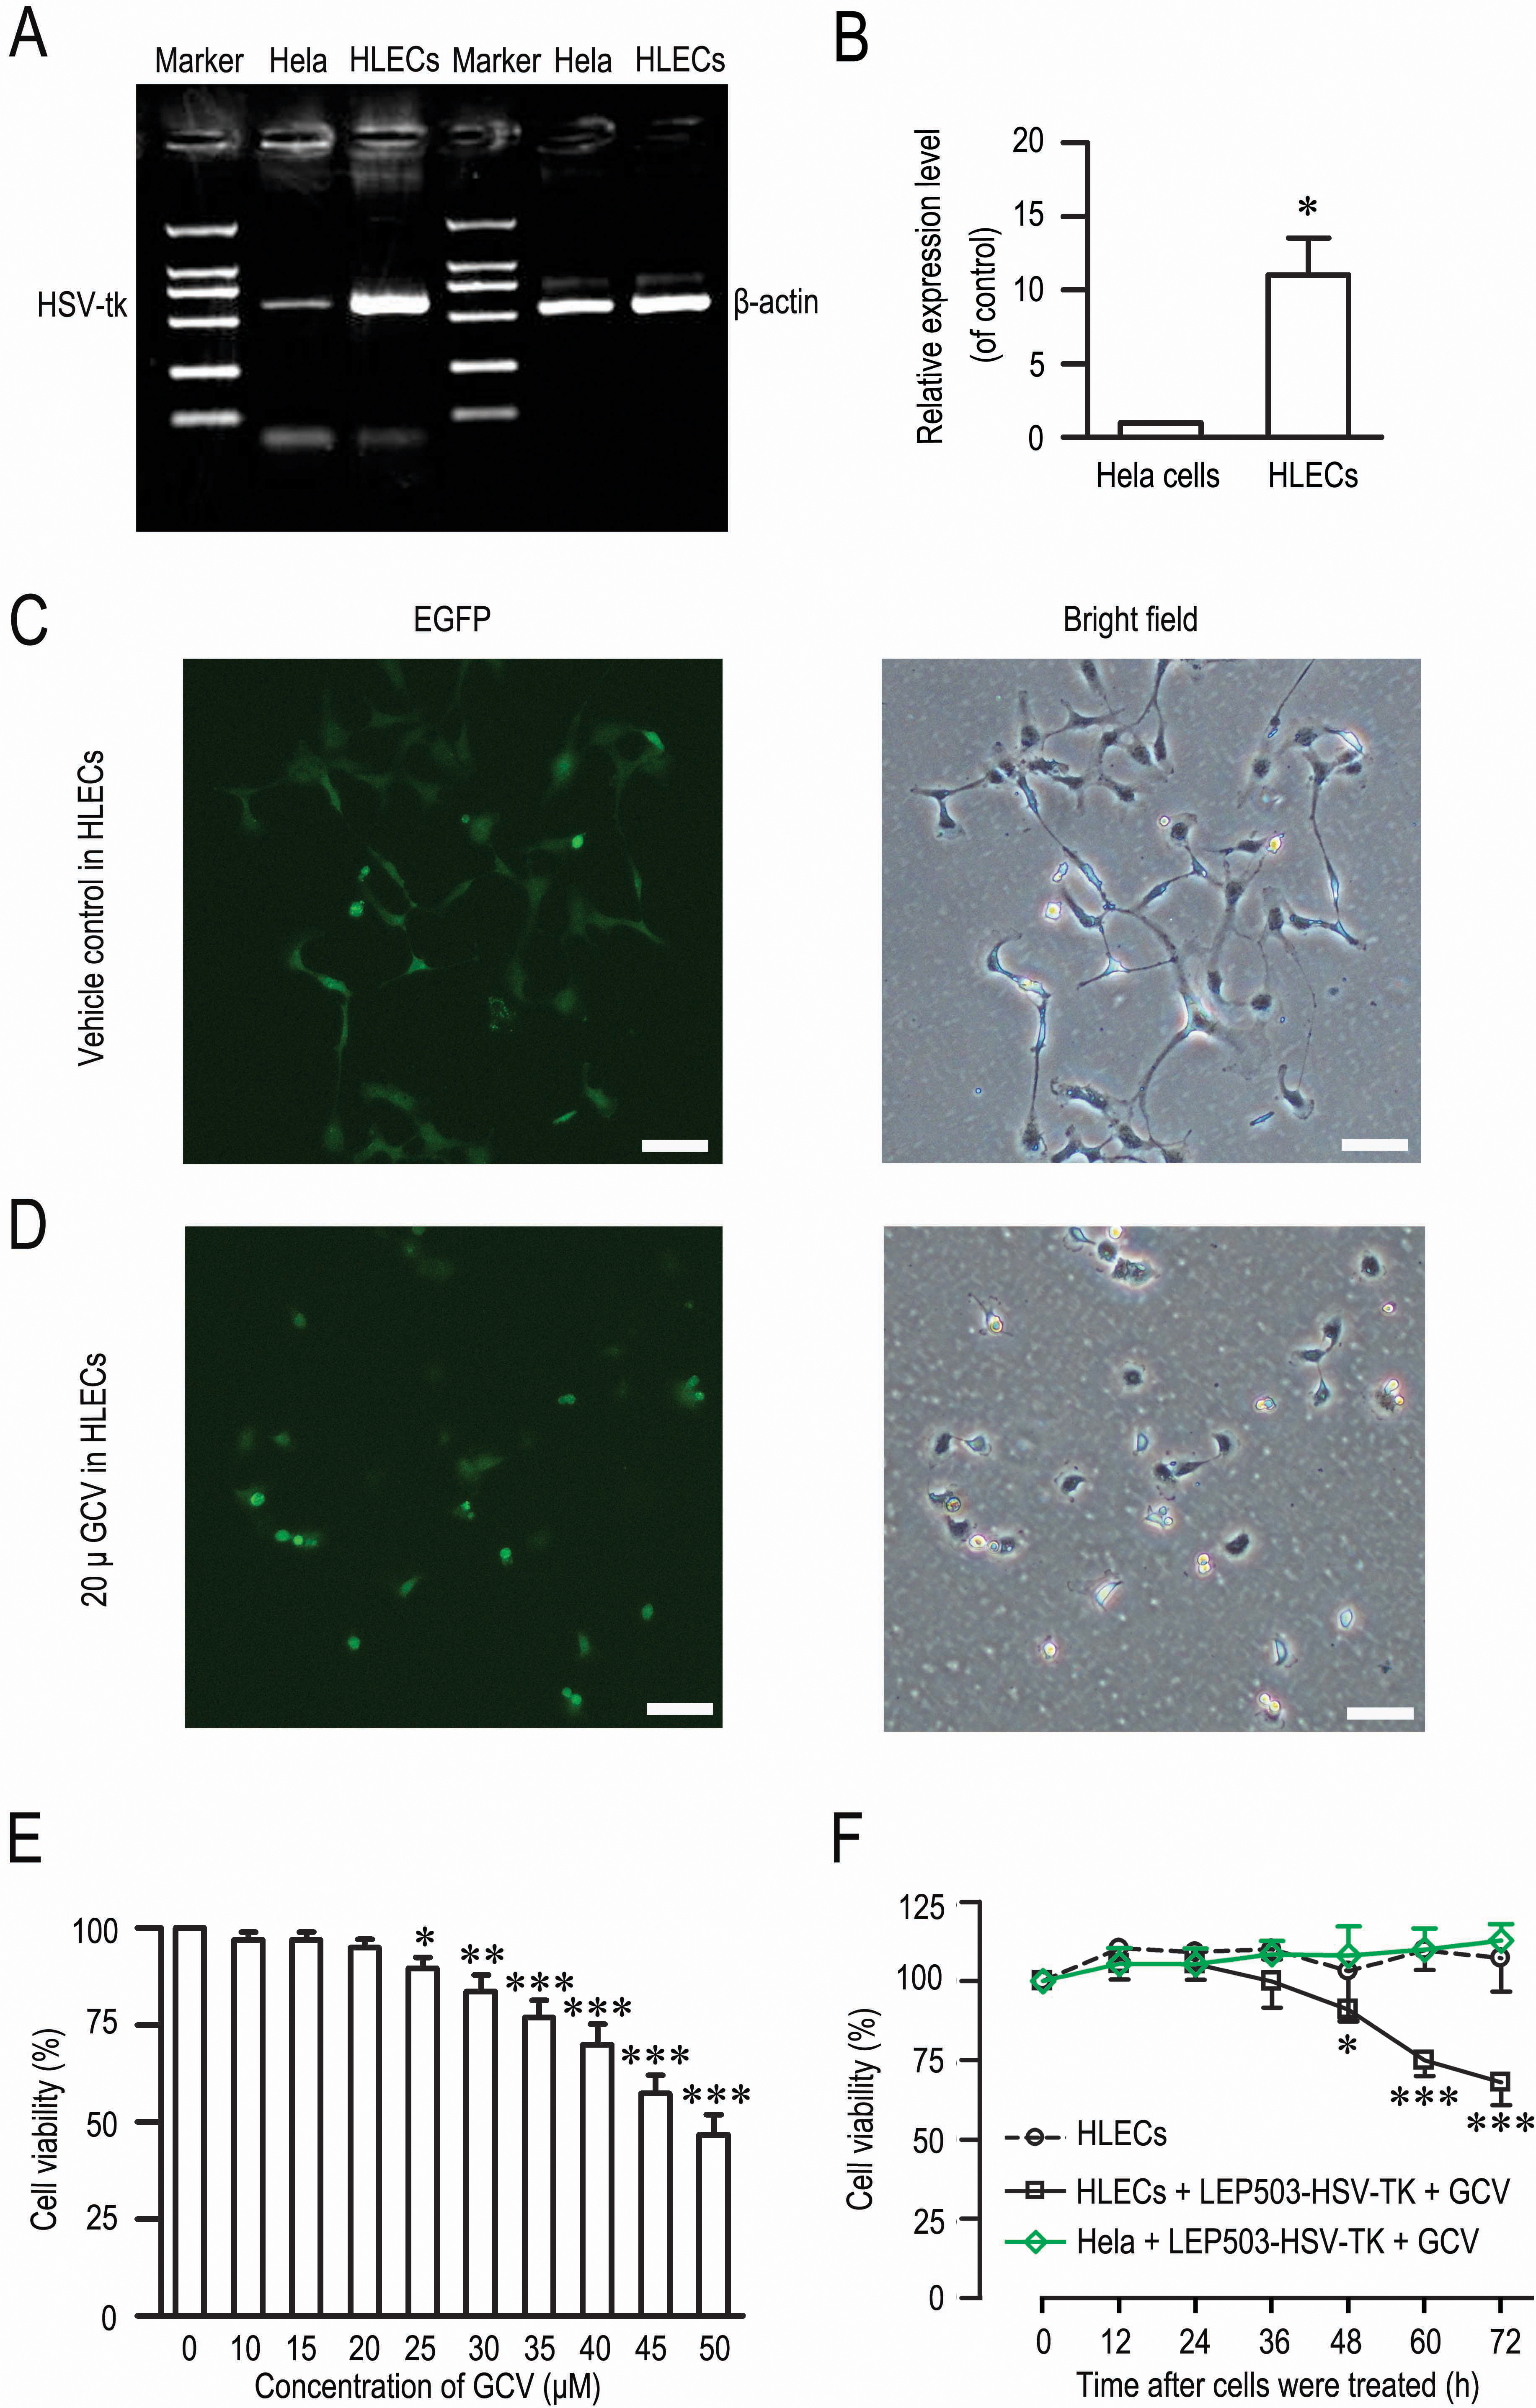
 Figure 3
of Yang, Mol Vis 2012; 18:2053-2066.
Figure 3
of Yang, Mol Vis 2012; 18:2053-2066.