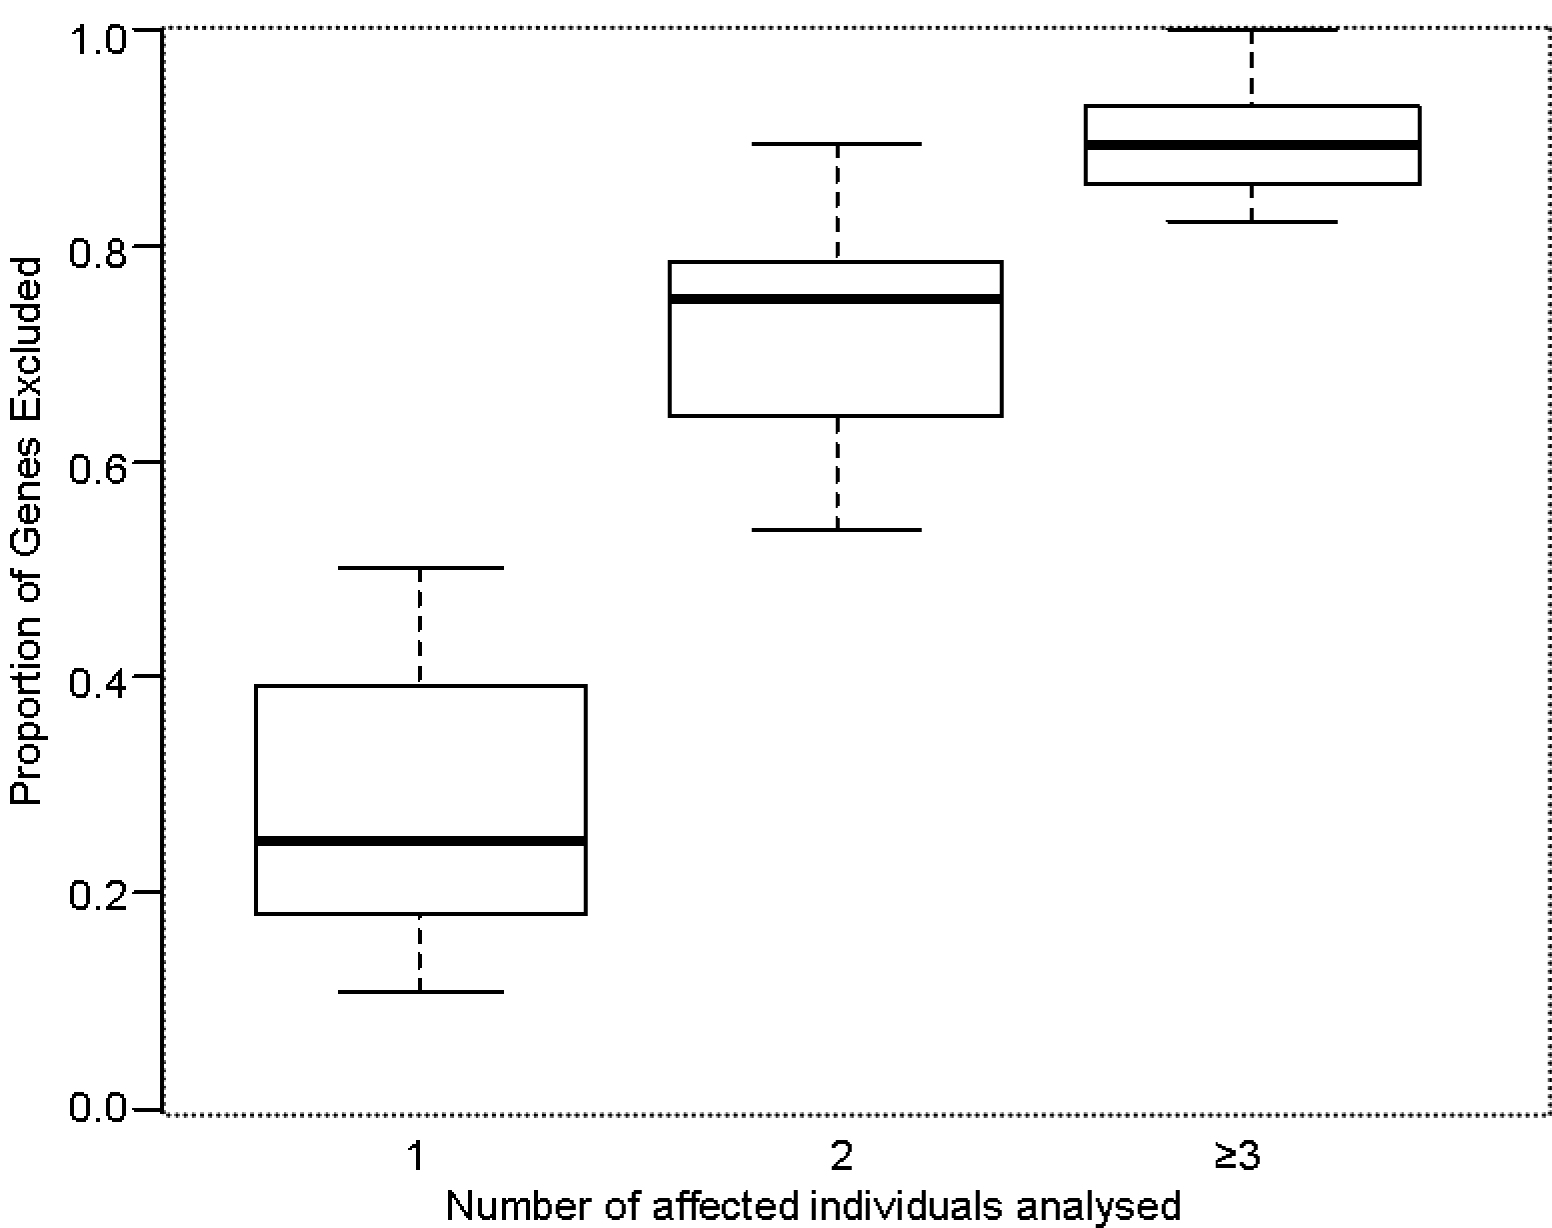
Figure 2. Proportion of genes
excluded according to the number of affected individuals
analyzed. Boxplot showing the proportion of genes excluded with
the single nucleotide polymorphism genotyping cosegregation
method, grouped according to the number of affected individuals
analyzed. Shown on the boxplot are quartiles, the range of
values for each group (whiskers), and the median values for each
group (bold horizontal bars).
Paterson, Mol Vis 2012; 18:2043-2052. http://www.molvis.org/molvis/v18/a215
©2012 Molecular Vision http://www.molvis.org/molvis/
ISSN 1090-0535
 Figure 2
of Paterson, Mol Vis 2012; 18:2043-2052.
Figure 2
of Paterson, Mol Vis 2012; 18:2043-2052.