Figure 1. Gene exclusion results for
each family. Summary of genes excluded from each family (highest
to lowest number excluded) showing the number of affected and
unaffected individuals analyzed, genes discarded with the SNP
genotyping method (black) or sequencing analyses (blue), as well
as non-discarded genes (white), LCA-specific genes (gray), and
the number of genes excluded with SNP genotyping analyses.
Likely mutations identified with DNA sequencing are shown in
red.
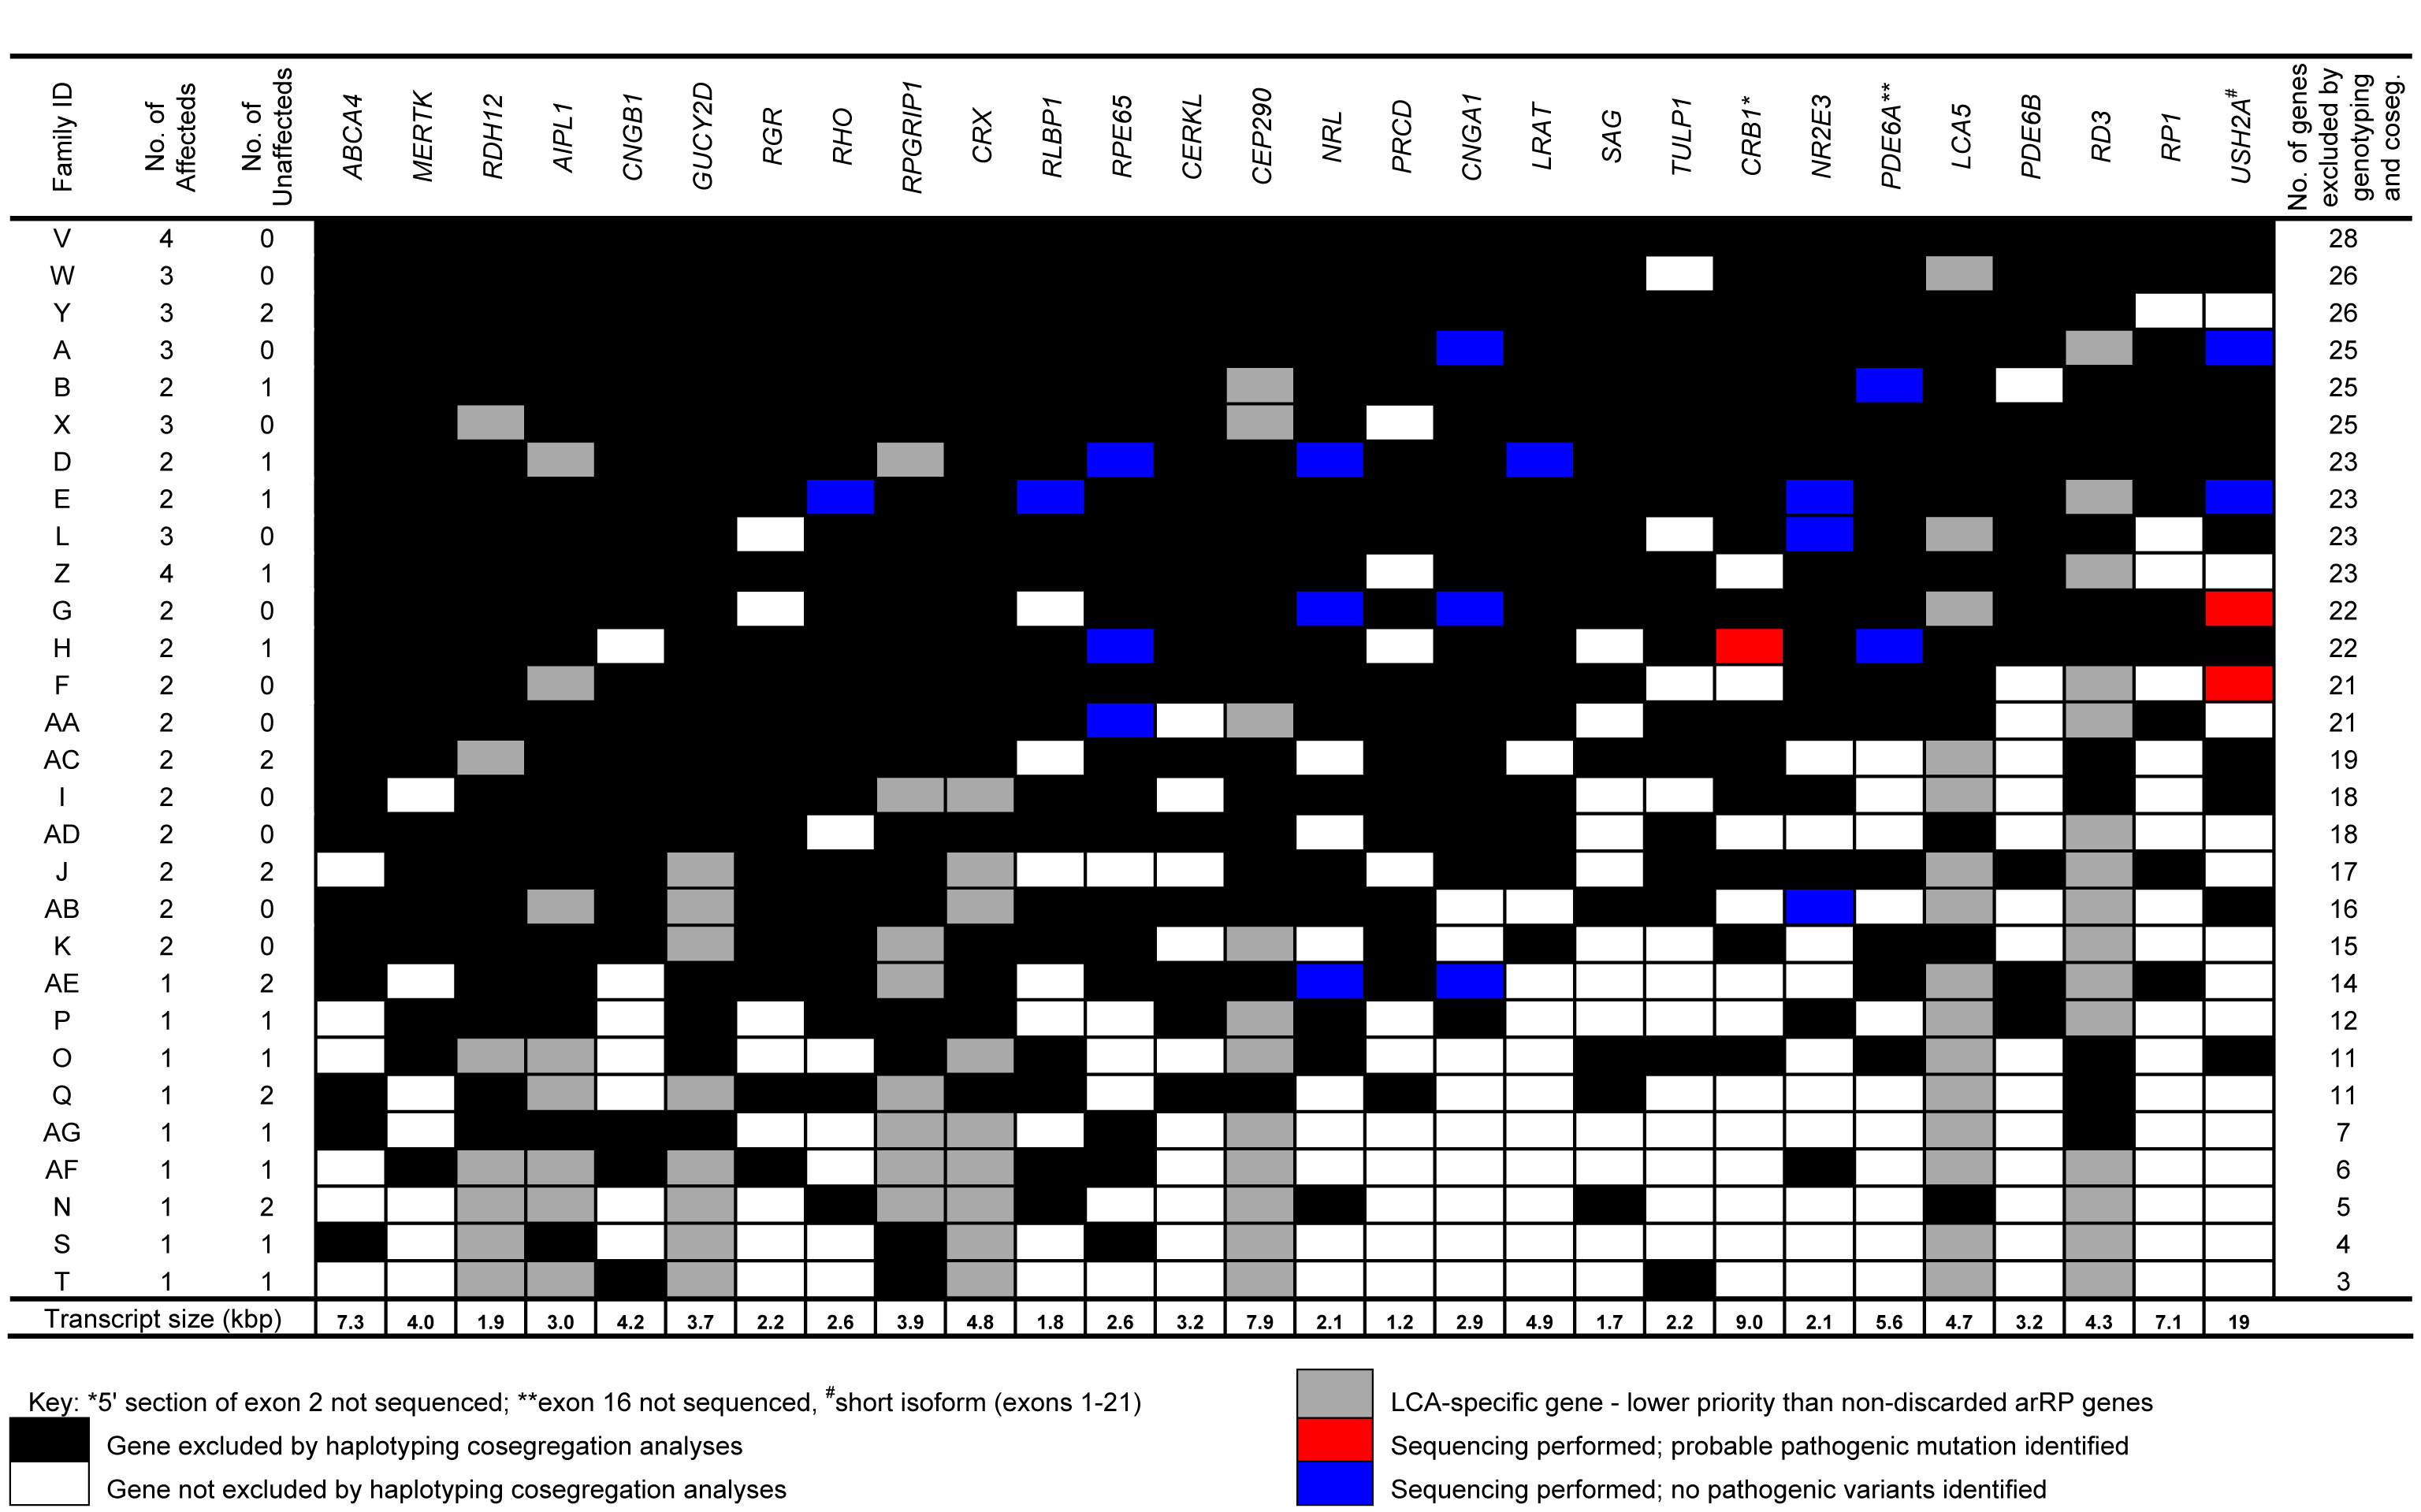
 Figure 1
of Paterson, Mol Vis 2012; 18:2043-2052.
Figure 1
of Paterson, Mol Vis 2012; 18:2043-2052.