Figure 6. Protein expressions of extracts from control and 20 μM gossypol-treated human retinoblastoma (Y79) cell cultures were detected
with western blotting. Panel A shows the target signal transduction proteins from the control and gossypol-treated groups. Panel B shows the ratio of increased expression in these proteins. The results indicate that the expressions of cytochrome C, caspase
8, caspase 9, caspase 3, DR5, p53, and Smac were upregulated by gossypol treatment. The Student t-test was used for statistical analysis. * p<0.05, compared to the control group, and n=3 in each group in (B).
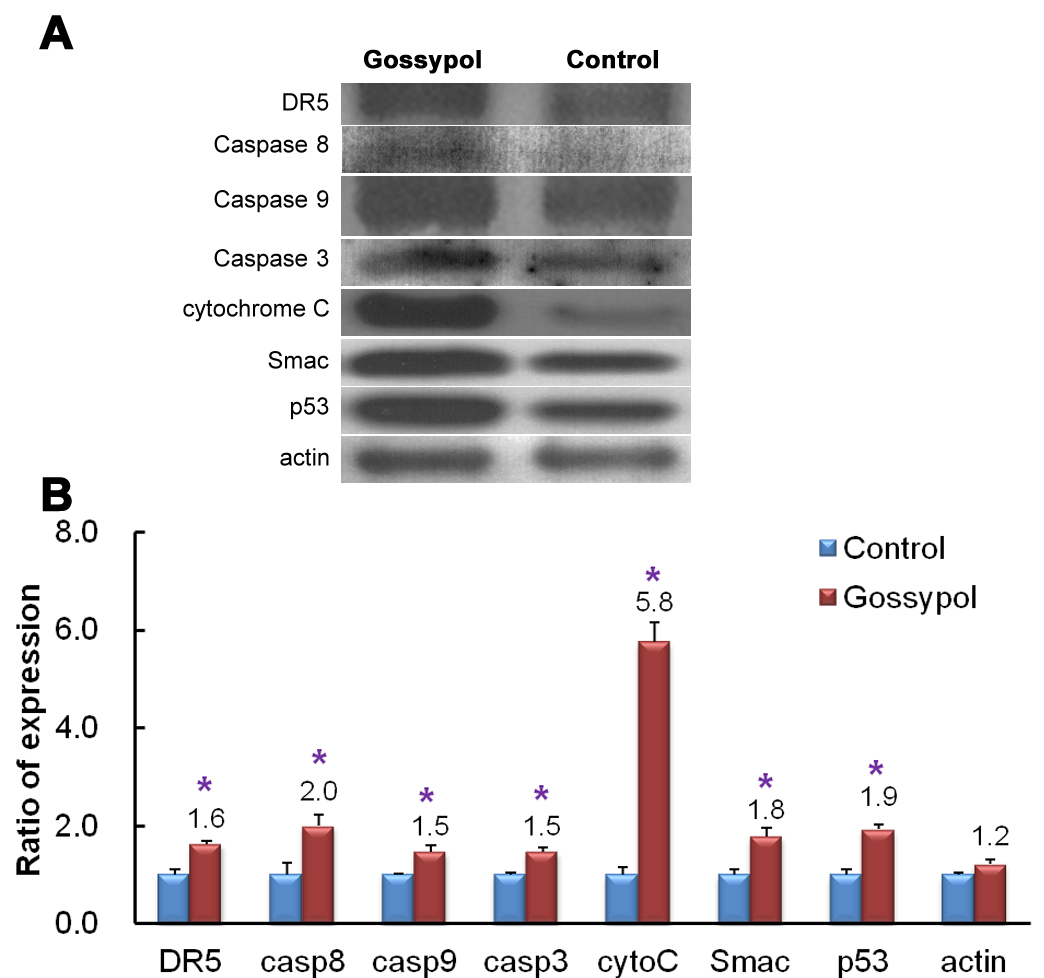
 Figure 6 of
Hsiao, Mol Vis 2012; 18:2033-2042.
Figure 6 of
Hsiao, Mol Vis 2012; 18:2033-2042.