Figure 5. Flow cytometry demonstrated the stages of cell cycle in human retinoblastoma (Y79) cells at different concentrations of gossypol.
Panel A shows the percentages of cells distributed in different cell cycle stages incubated with different concentrations of gossypol
for 24 h. Data are presented as the mean±SEM. One-way ANOVA with a Bonferroni multiple comparison was used for statistical
analysis. * p<0.05, compared to the control group. Panels B to F show the distribution of cells in different cell cycle stages in different concentrations of gossypol. n=3–4. RN1 represents
the G0/G1 phase, RN2 the G1 phase, RN3 the S phase, and RN4 the G2/M phase.
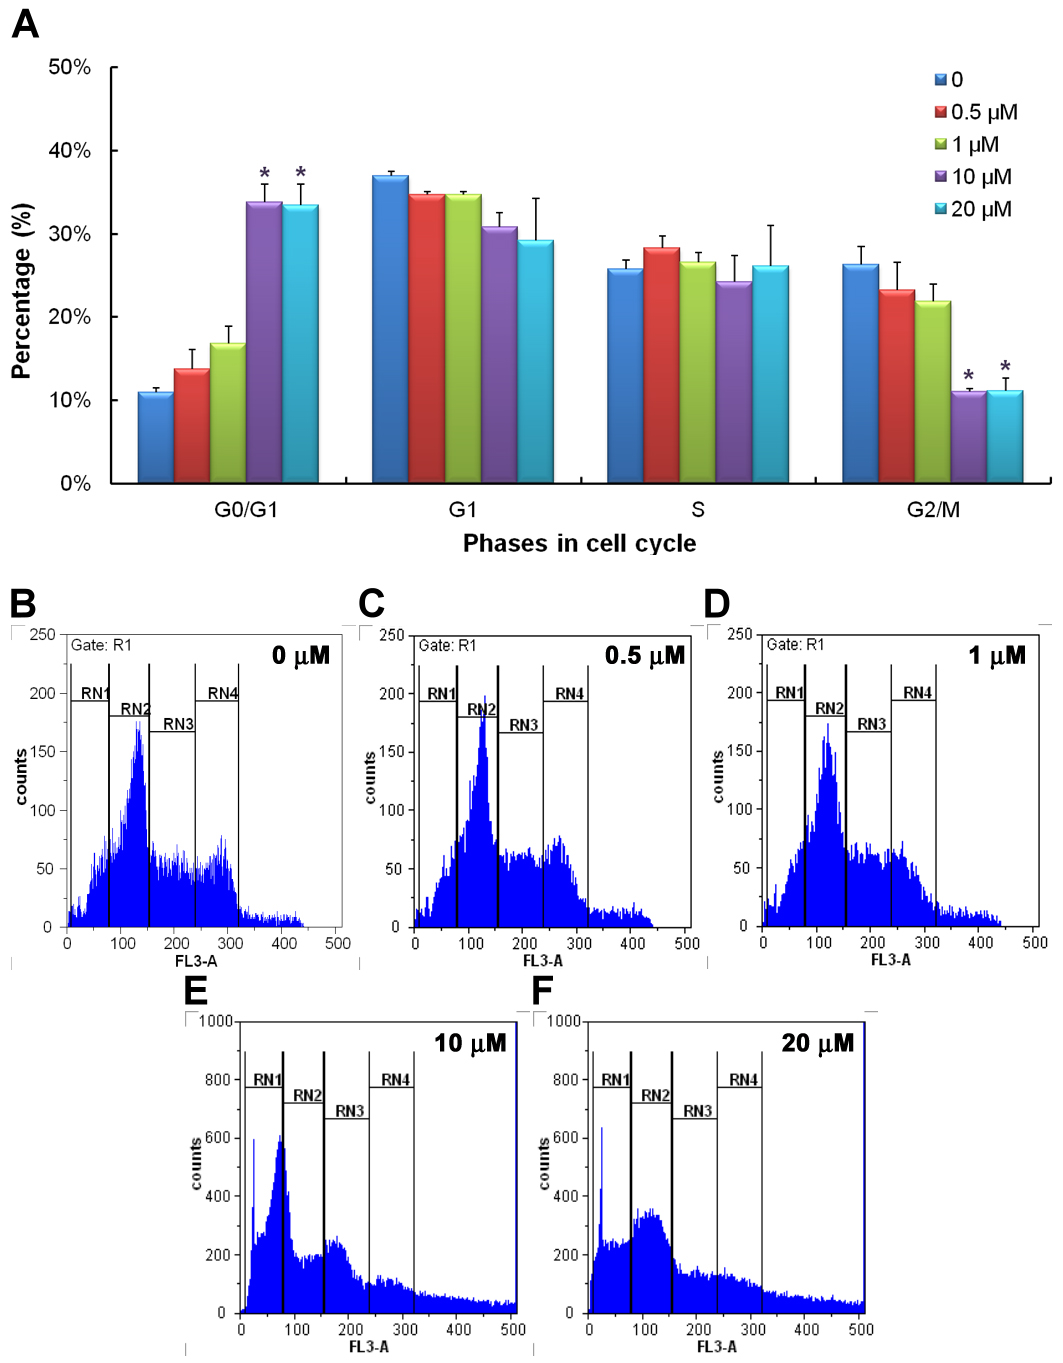
 Figure 5 of
Hsiao, Mol Vis 2012; 18:2033-2042.
Figure 5 of
Hsiao, Mol Vis 2012; 18:2033-2042.