Figure 4. Flow cytometry demonstrated
the stages of cell apoptosis in human retinoblastoma (Y79) cells
at different time points and for different concentrations of
gossypol. Panels A and B show the percentages of
different apoptotic stages in cells incubated with different
concentrations of gossypol for 12 and 24 h. Data are presented
as the mean±SEM. One-way ANOVA with a Bonferroni multiple
comparison was used for statistical analysis. * p<0.05,
compared to the control group. # p<0.05, compared to
the 12-h group at the same dose. Images (C) and (D)
show the distribution of cells in different apoptotic stages
with gossypol treatment for (C) 12 h and (D) 24 h,
by collecting the annexin V signals as FL1 and propidium iodide
(PI) signals as FL3. n=6 in each group. Q3 shows the normal cell
population; Q4 presents the early apoptosis stage and Q2 the
late apoptosis stage.
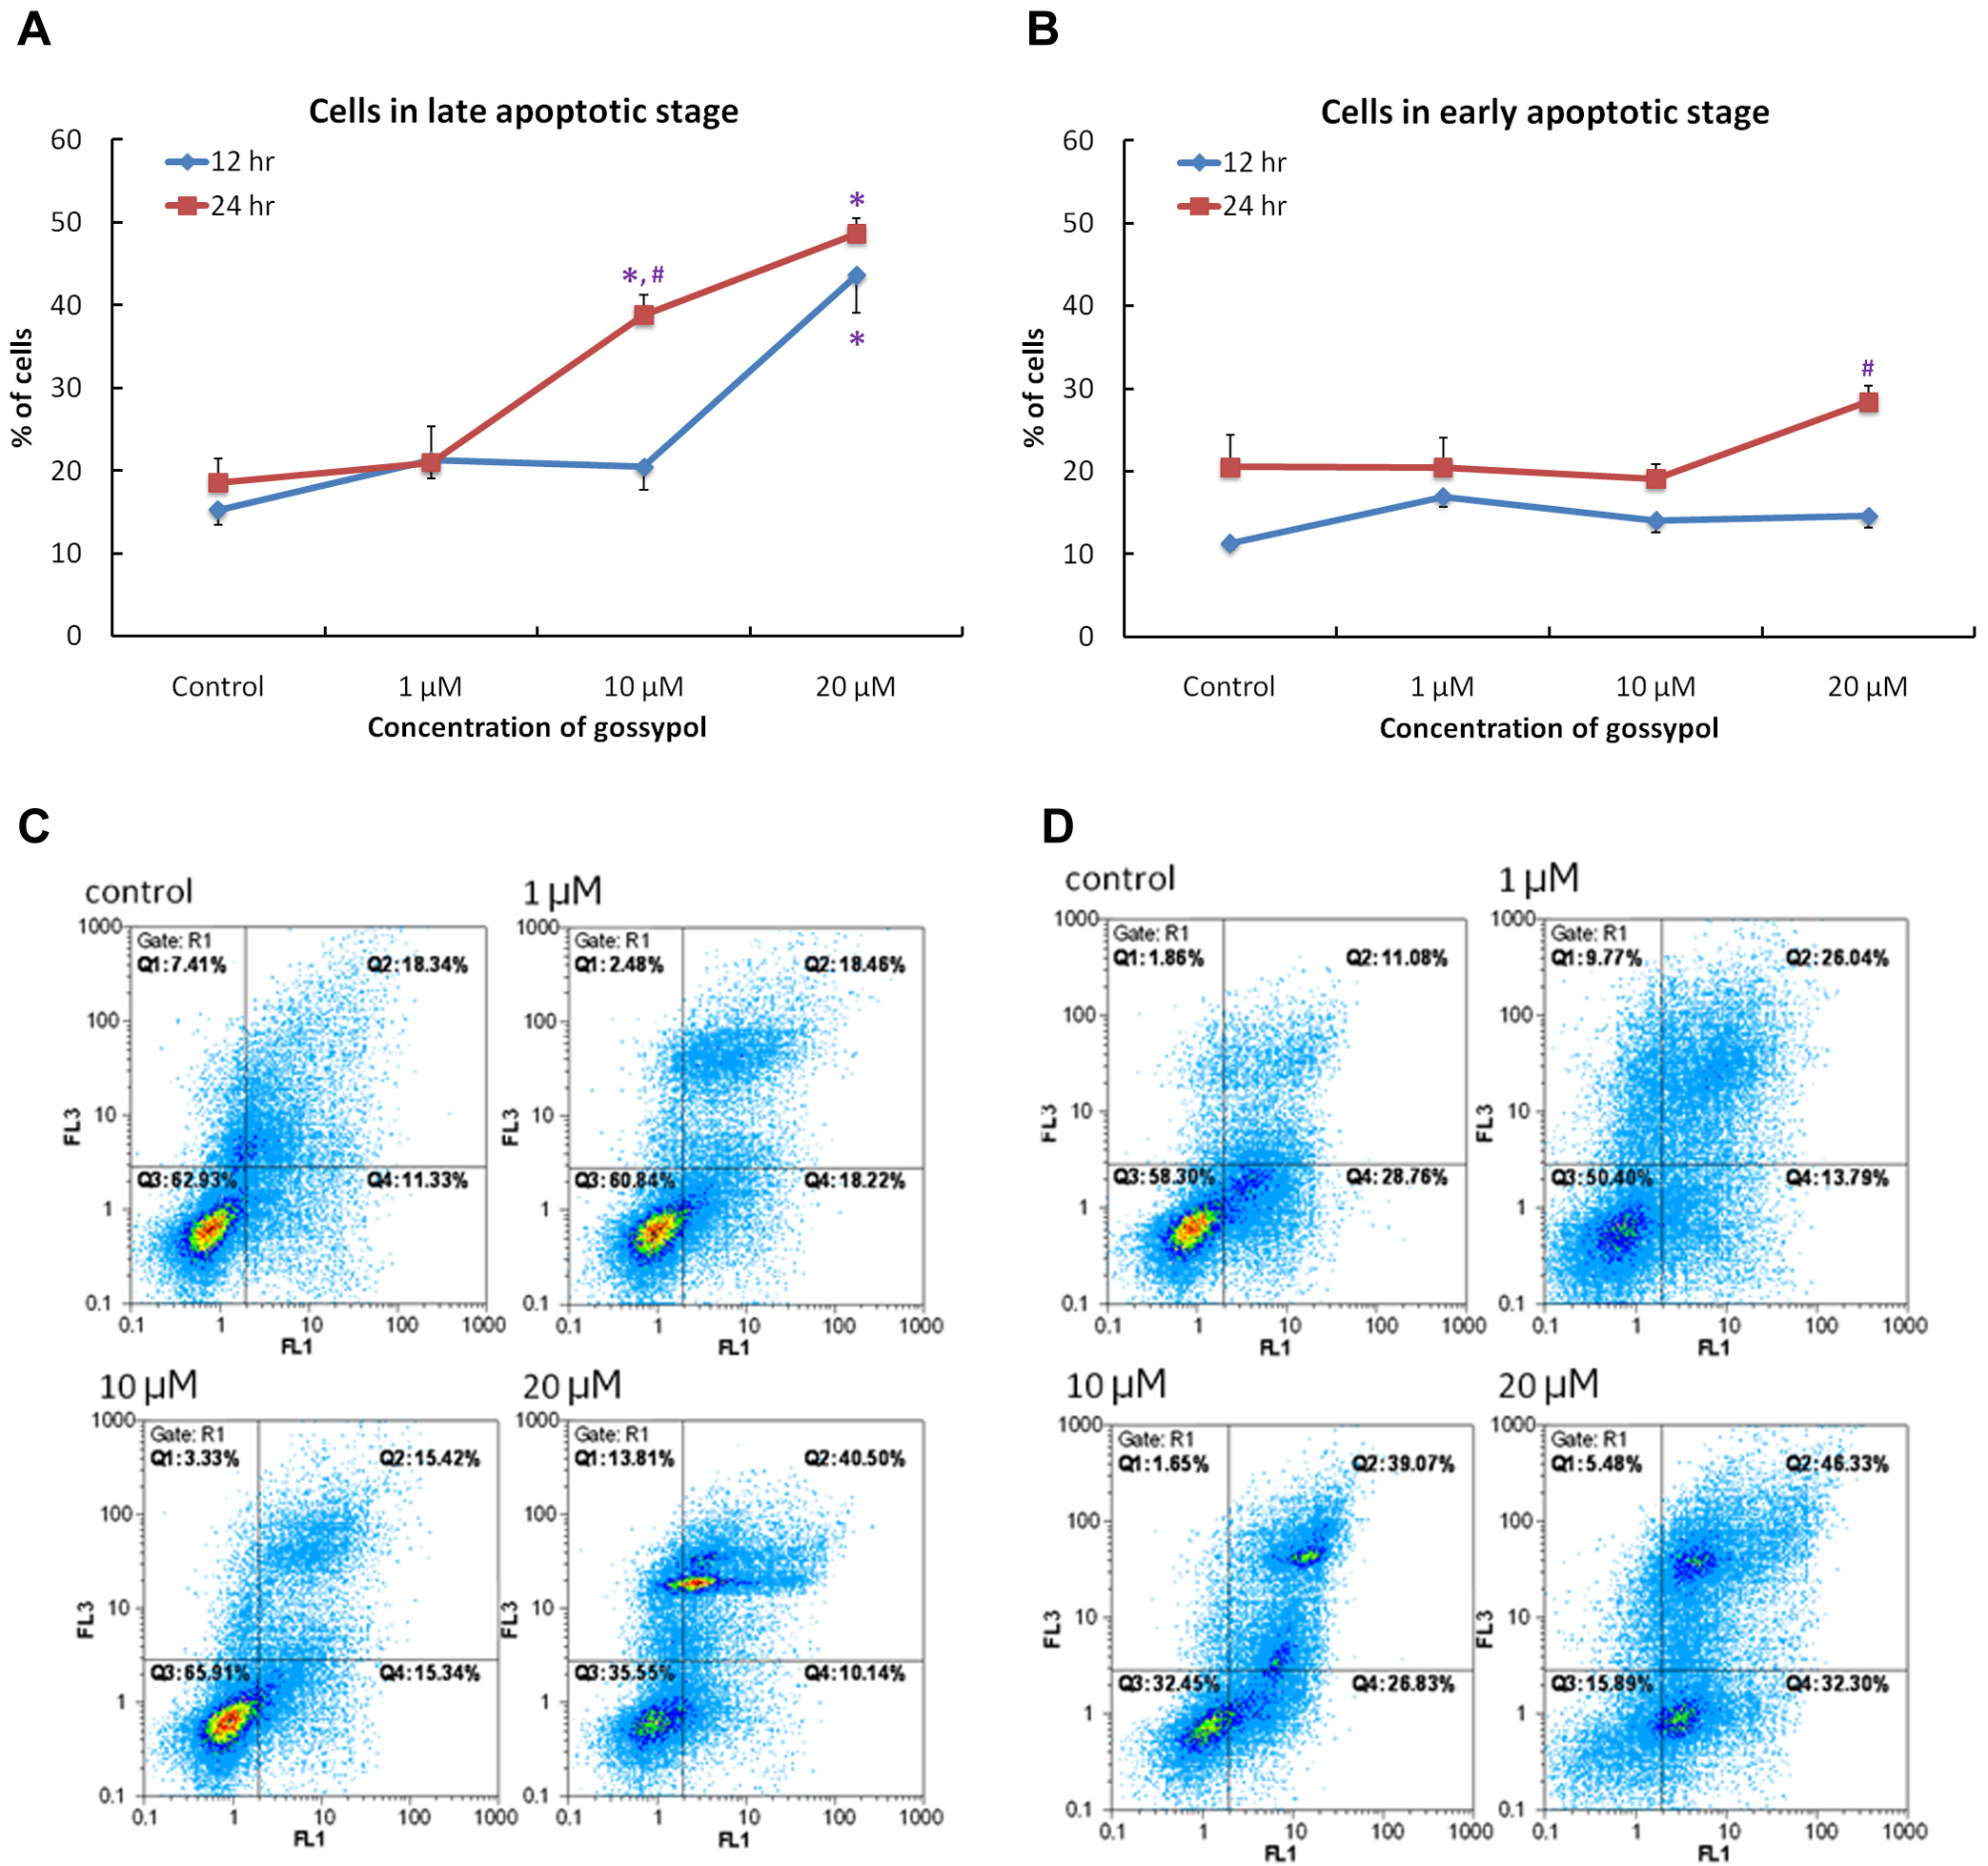
 Figure 4
of Hsiao, Mol Vis 2012; 18:2033-2042.
Figure 4
of Hsiao, Mol Vis 2012; 18:2033-2042.