Figure 3. Human retinoblastoma (Y79)
cells stained with annexin V and propidium iodide (PI) showing
the different stages of apoptosis. A, B, and C
are control groups. D, E, and F are 1 μM
gossypol. G, H, and I are 10 μM
gossypol. J, K, and L are 20 μM gossypol
cultures. Scale bar is 50 μm.
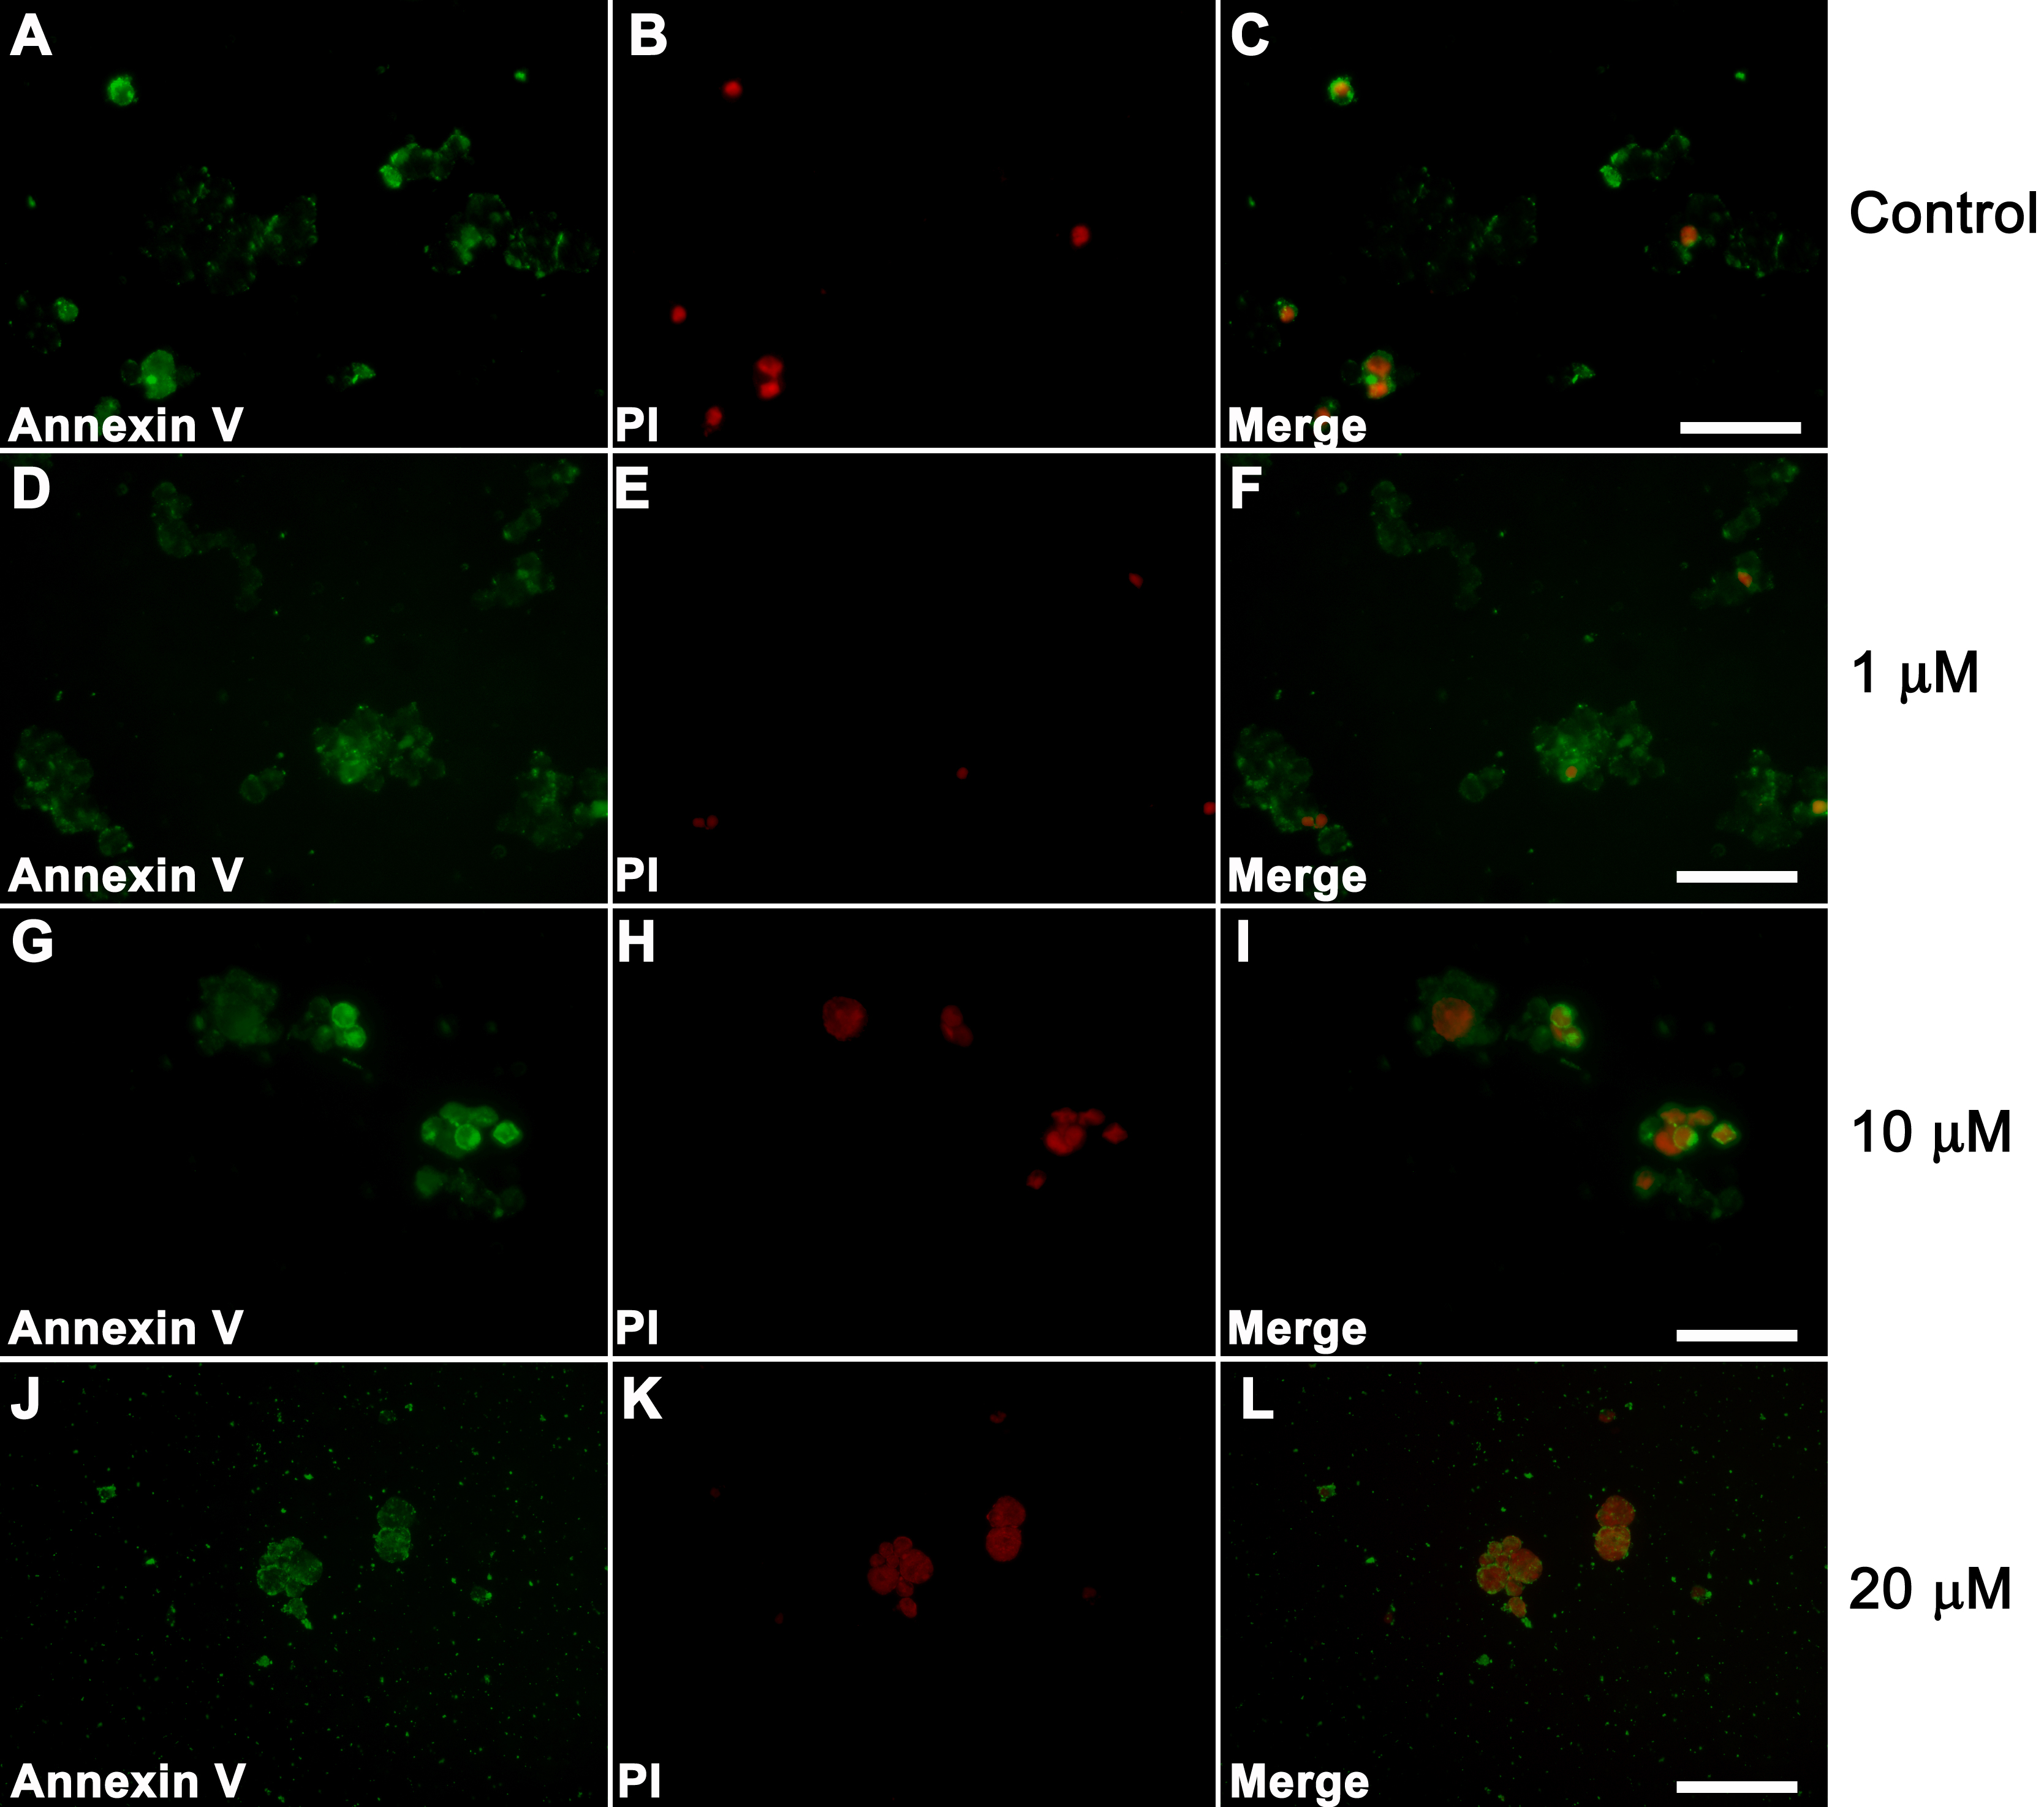
 Figure 3
of Hsiao, Mol Vis 2012; 18:2033-2042.
Figure 3
of Hsiao, Mol Vis 2012; 18:2033-2042.