Figure 4. Deletion analysis of the DMD
gene. A: Results of multiplex PCR showing the deletion
of exons 49, 50 and 51 (marked by arrows) in affected individual
IV-3. B: MLPA analysis of the affected individual IV-3
showing the deletion of exons 49, 50 and 51 (marked by arrows).
Abbreviation: N, normal unrelated individual.
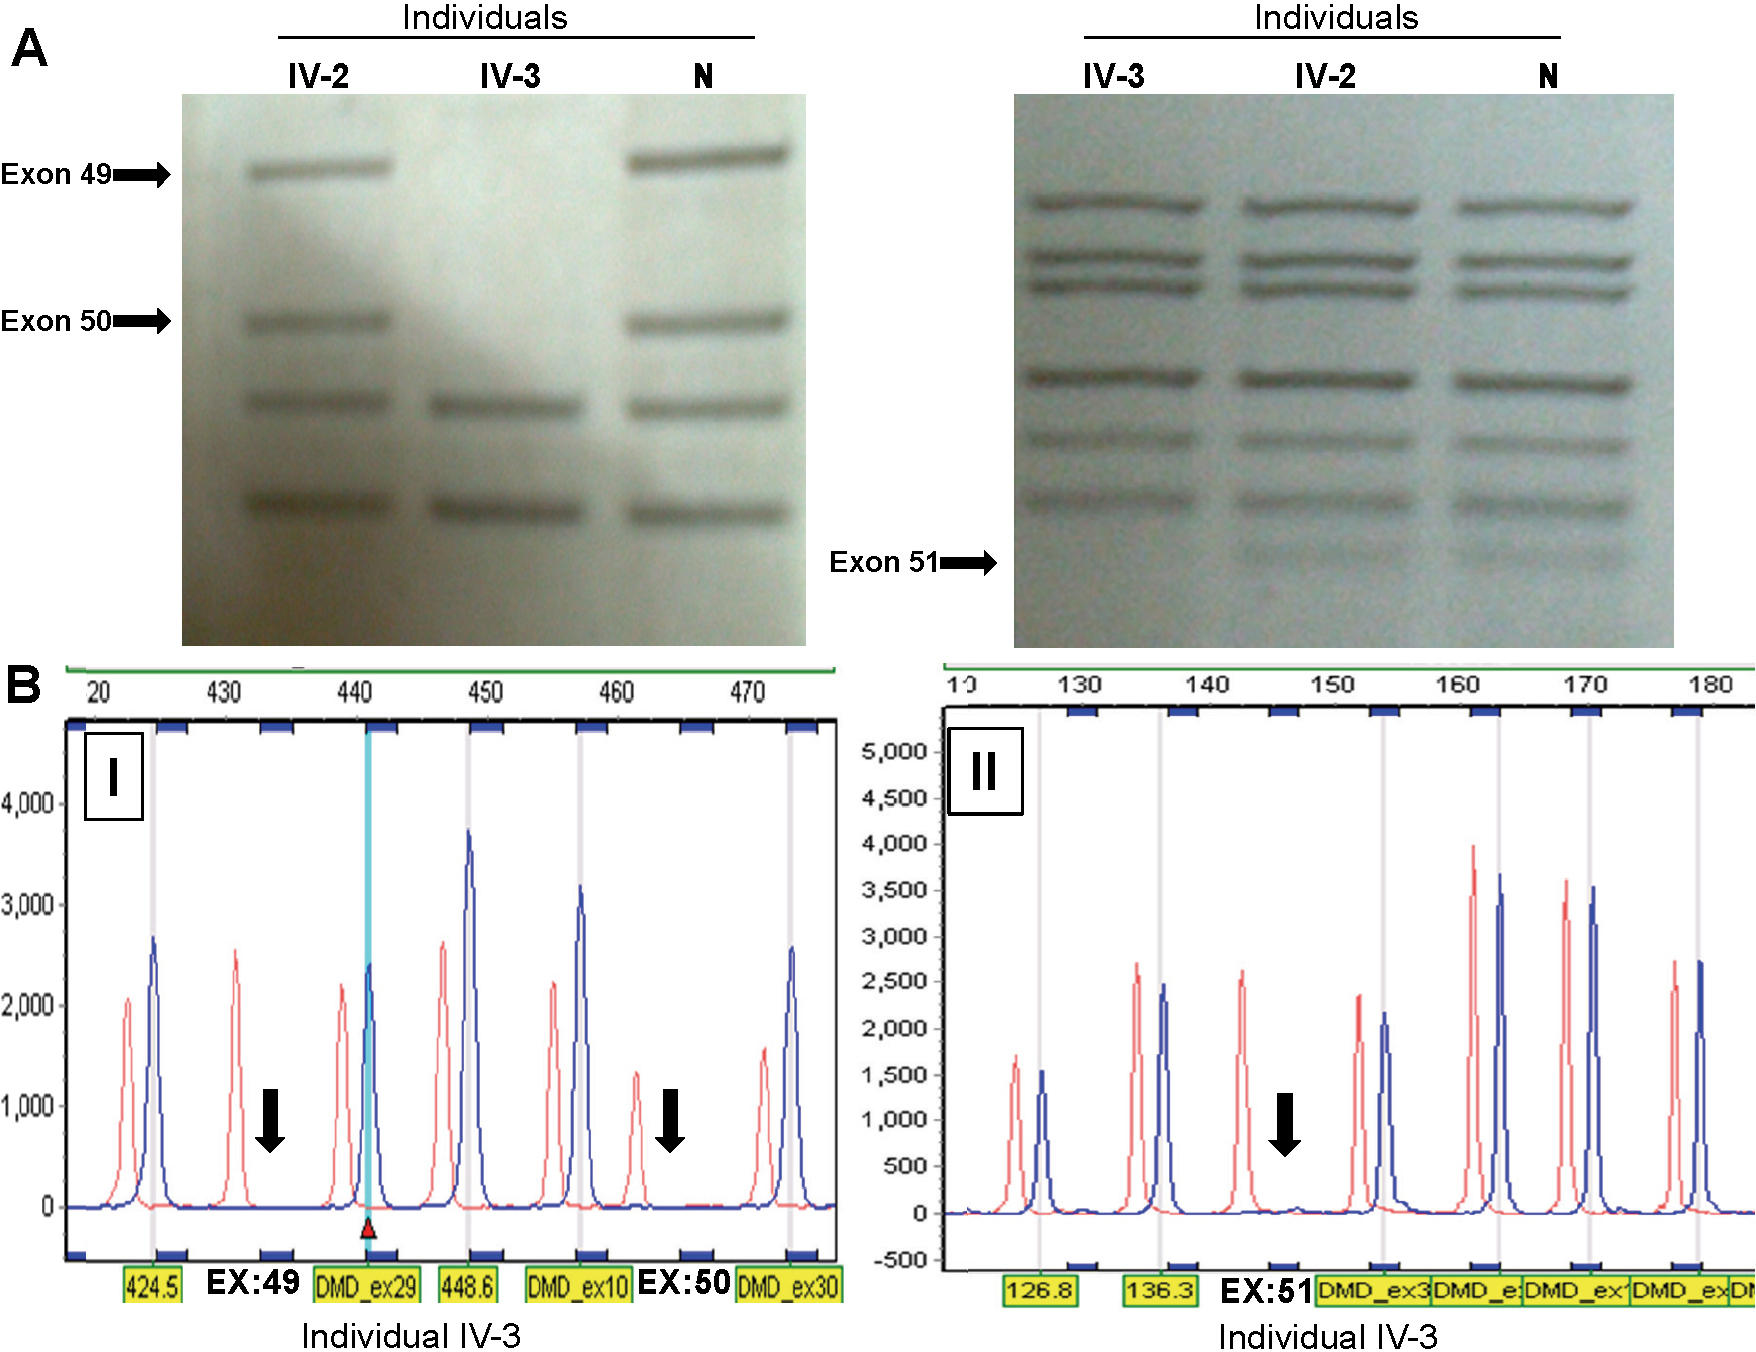
 Figure 4
of Kapoor, Mol Vis 2012; 18:2022-2032.
Figure 4
of Kapoor, Mol Vis 2012; 18:2022-2032.