Figure 3. Mutation analysis of the EDN3
gene in the family. A: Sequencing chromatograms of
individuals from the family. Note the homozygous change C>T
in both affected individuals IV-2 and IV-3 (marked by arrows).
The normal sibling IV-1 is homozygous for the wild-type allele,
whereas both parents (III-2 and III-3) and grandmother (II-2)
are heterozygous for the change (see double peaks marked by
arrows). B: RFLP analysis to show segregation of the
mutation. Note affected individuals have only 528 bp fragment
due to loss of the Eco72I site, the normal sibling has 345 and
183 bp fragments, and both carrier parents have all the three
fragments. C: Conservation of the threonine (T) residue
in different orthologs. The threonine residues are shown in bold
letters. The number refers to the position of amino acid
residue.
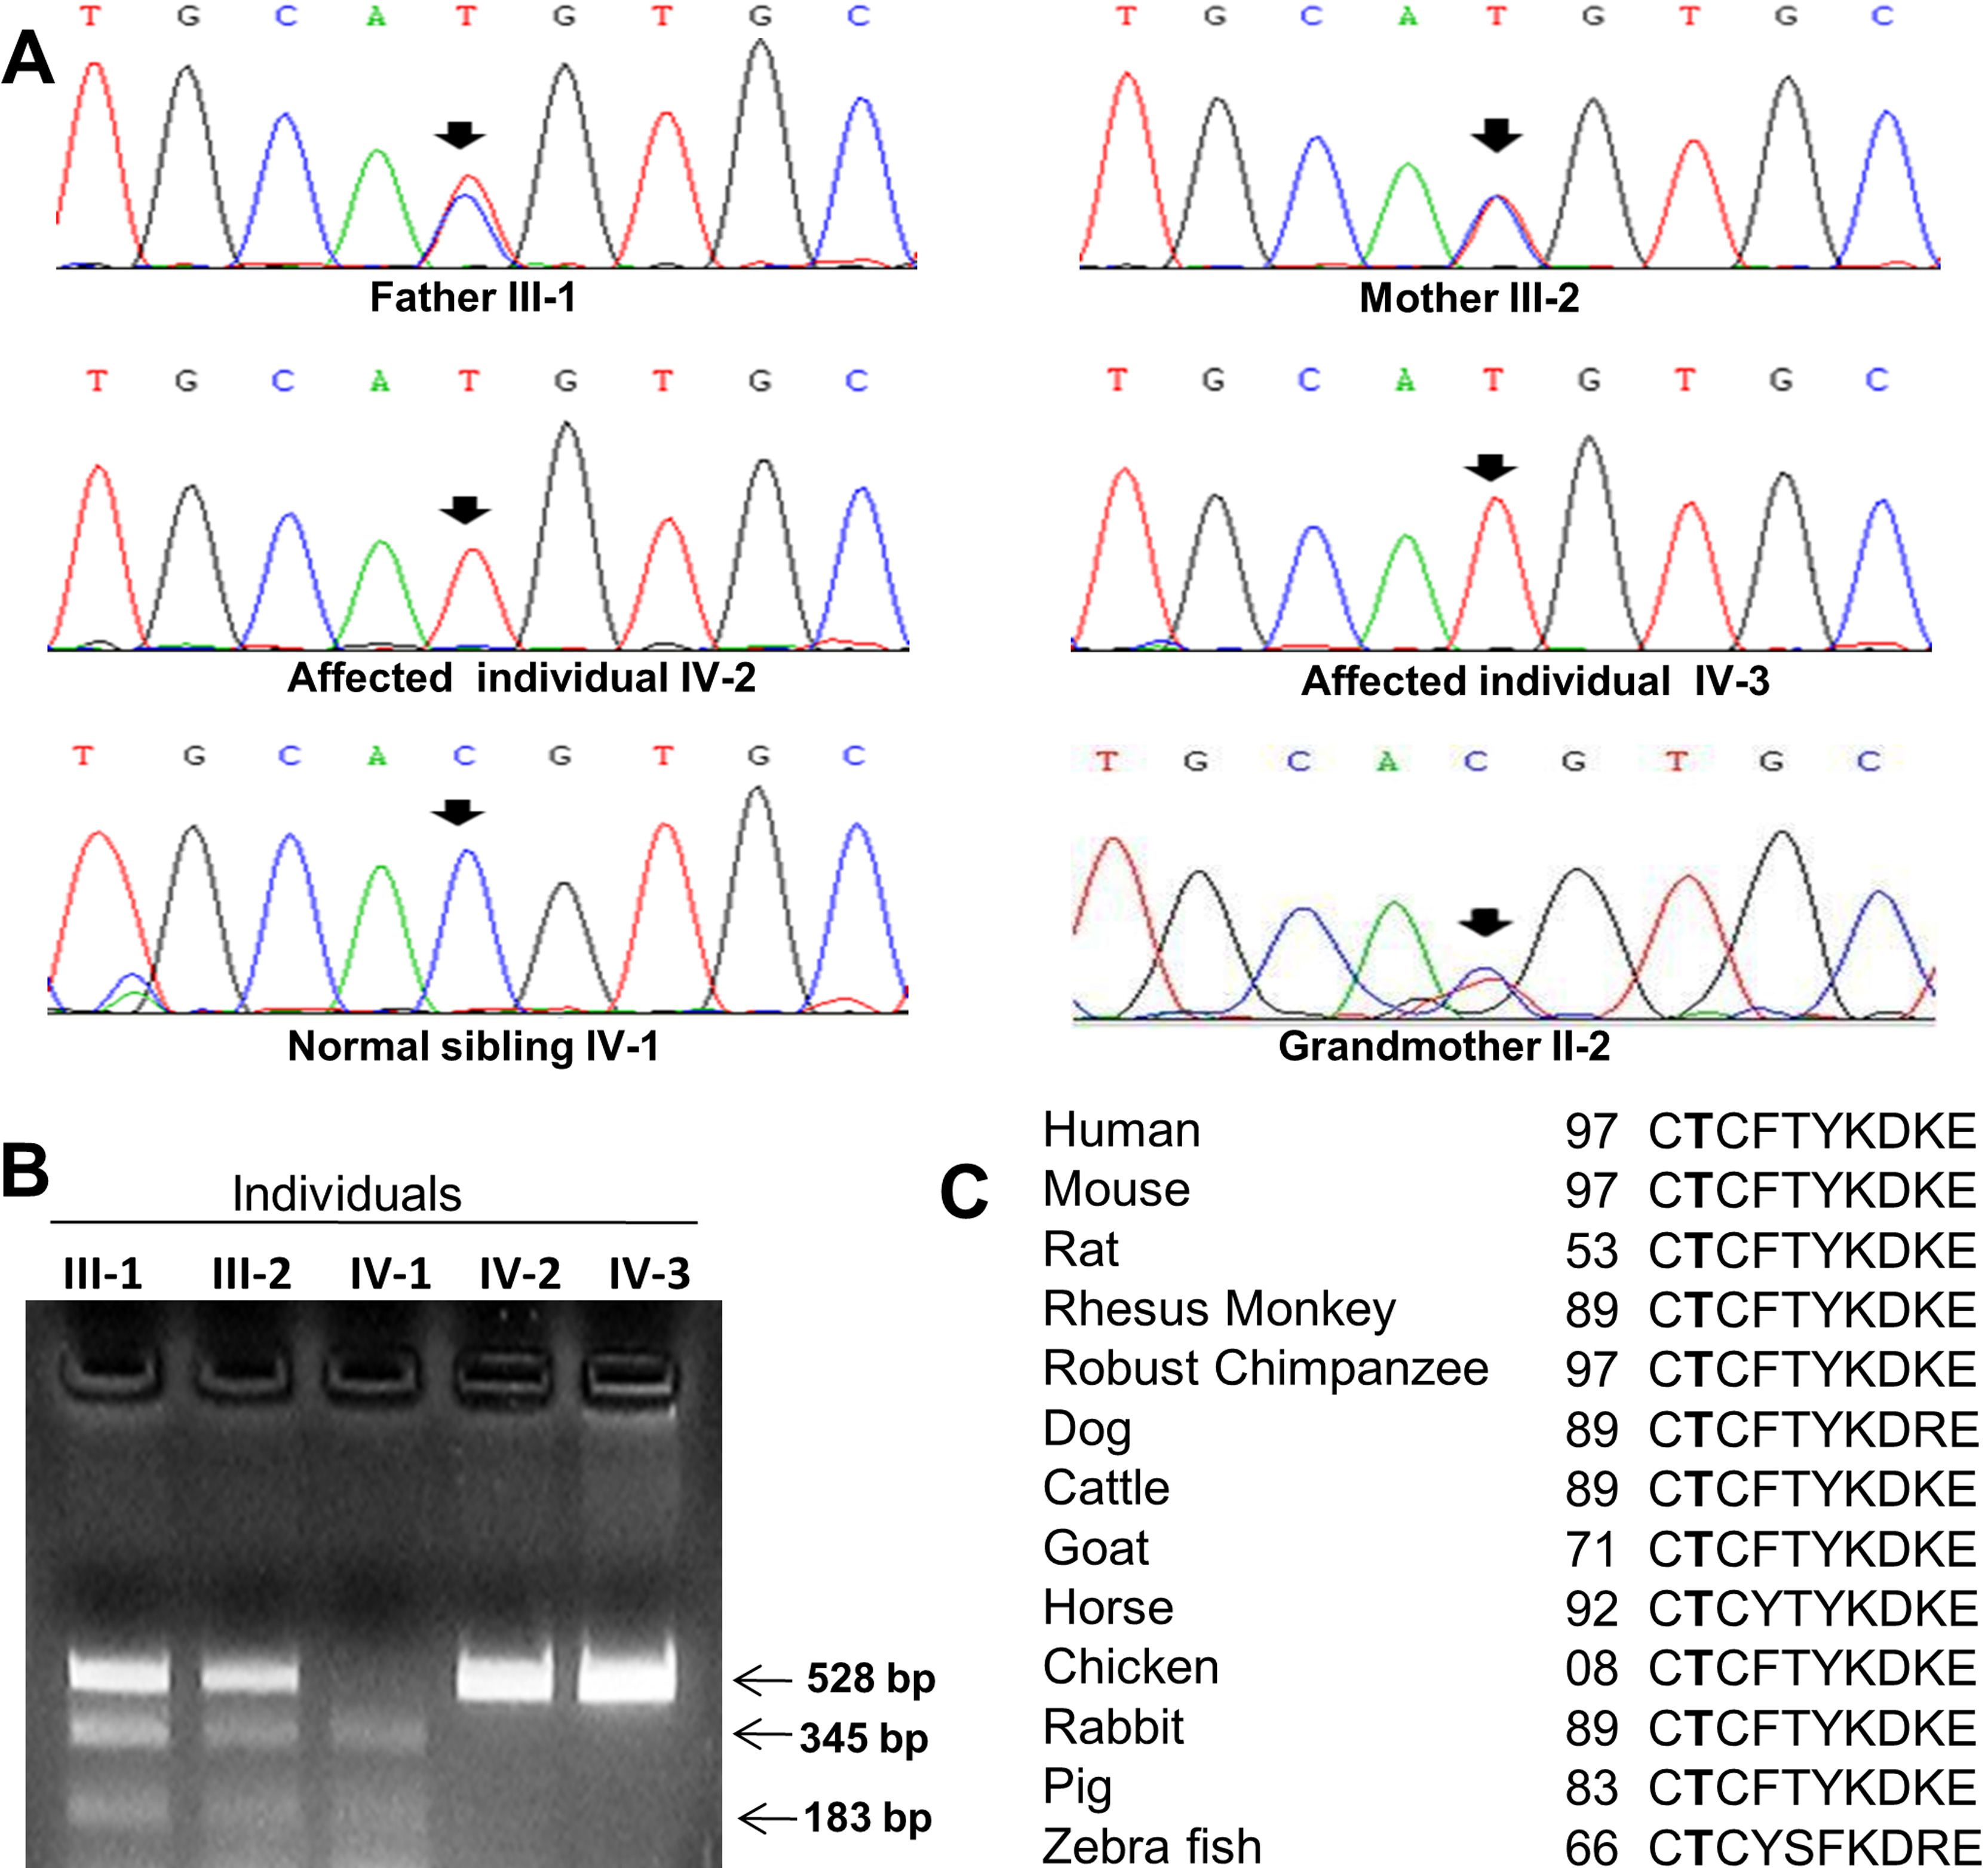
 Figure 3
of Kapoor, Mol Vis 2012; 18:2022-2032.
Figure 3
of Kapoor, Mol Vis 2012; 18:2022-2032.