Figure 1. The haplotype analysis of
the family with microsatellite markers from the EDN3
candidate region. The disease haplotype 2–1 is shown by black
bars. Note the affected individuals (IV-2 and IV-3) are
homozygous for the disease haplotype, whereas both parents III-
1 and III-2 are heterozygous for the disease haplotype and are
therefore carriers for the mutation. An arrow marks the index
case.
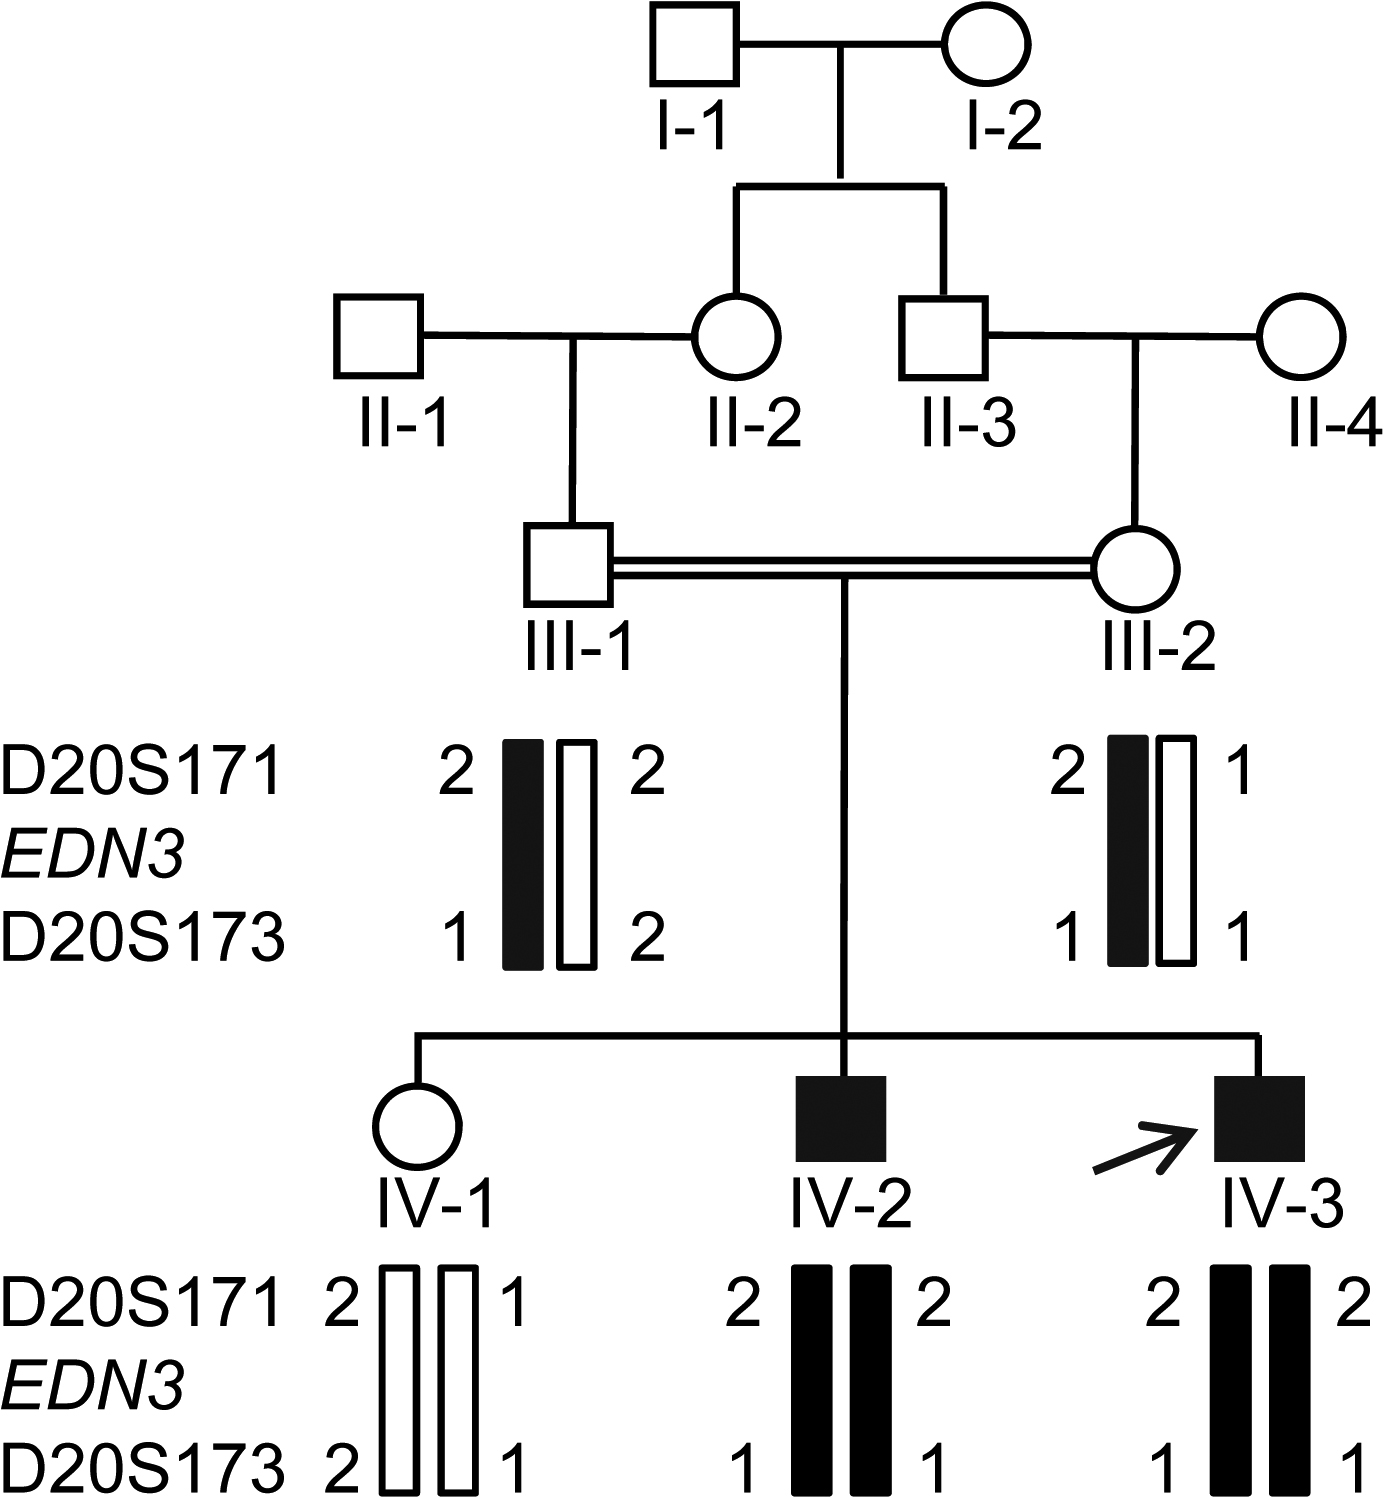
 Figure 1
of Kapoor, Mol Vis 2012; 18:2022-2032.
Figure 1
of Kapoor, Mol Vis 2012; 18:2022-2032.