Figure 2. Distribution of protein ratios. The log2 mean distribution of protein ratios (Dex-treated TM/untreated TM) are shown for all 718 quantified proteins and 341 proteins
quantified in ≥3 cell samples. Median, mean and SD values are indicated; protein ratios between 1 and 2 SD from the mean are
shaded. The distribution of protein ratios is near-to-normal.
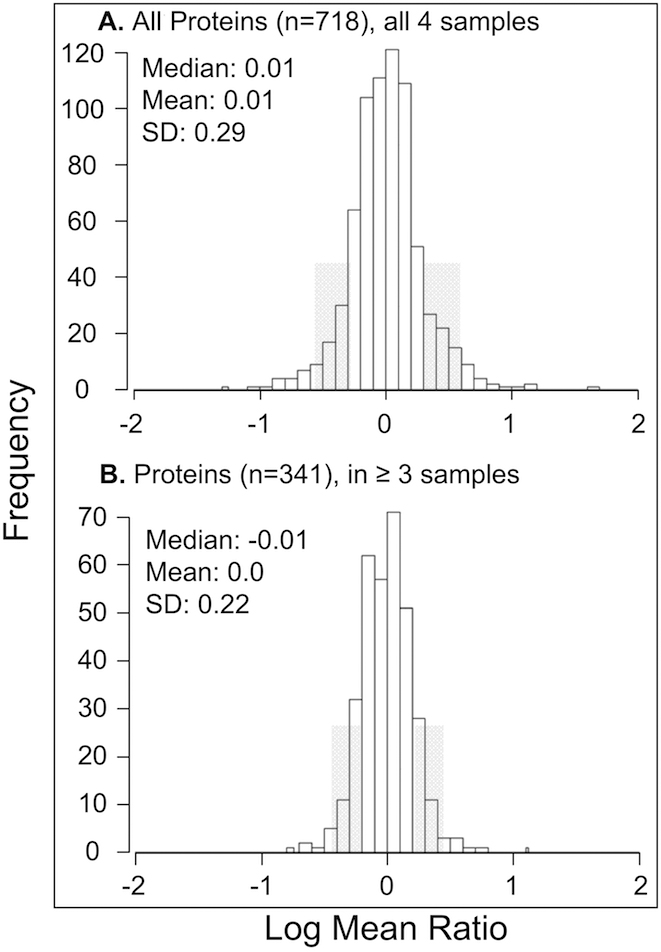
 Figure 2 of
Bollinger, Mol Vis 2012; 18:2001-2011.
Figure 2 of
Bollinger, Mol Vis 2012; 18:2001-2011.