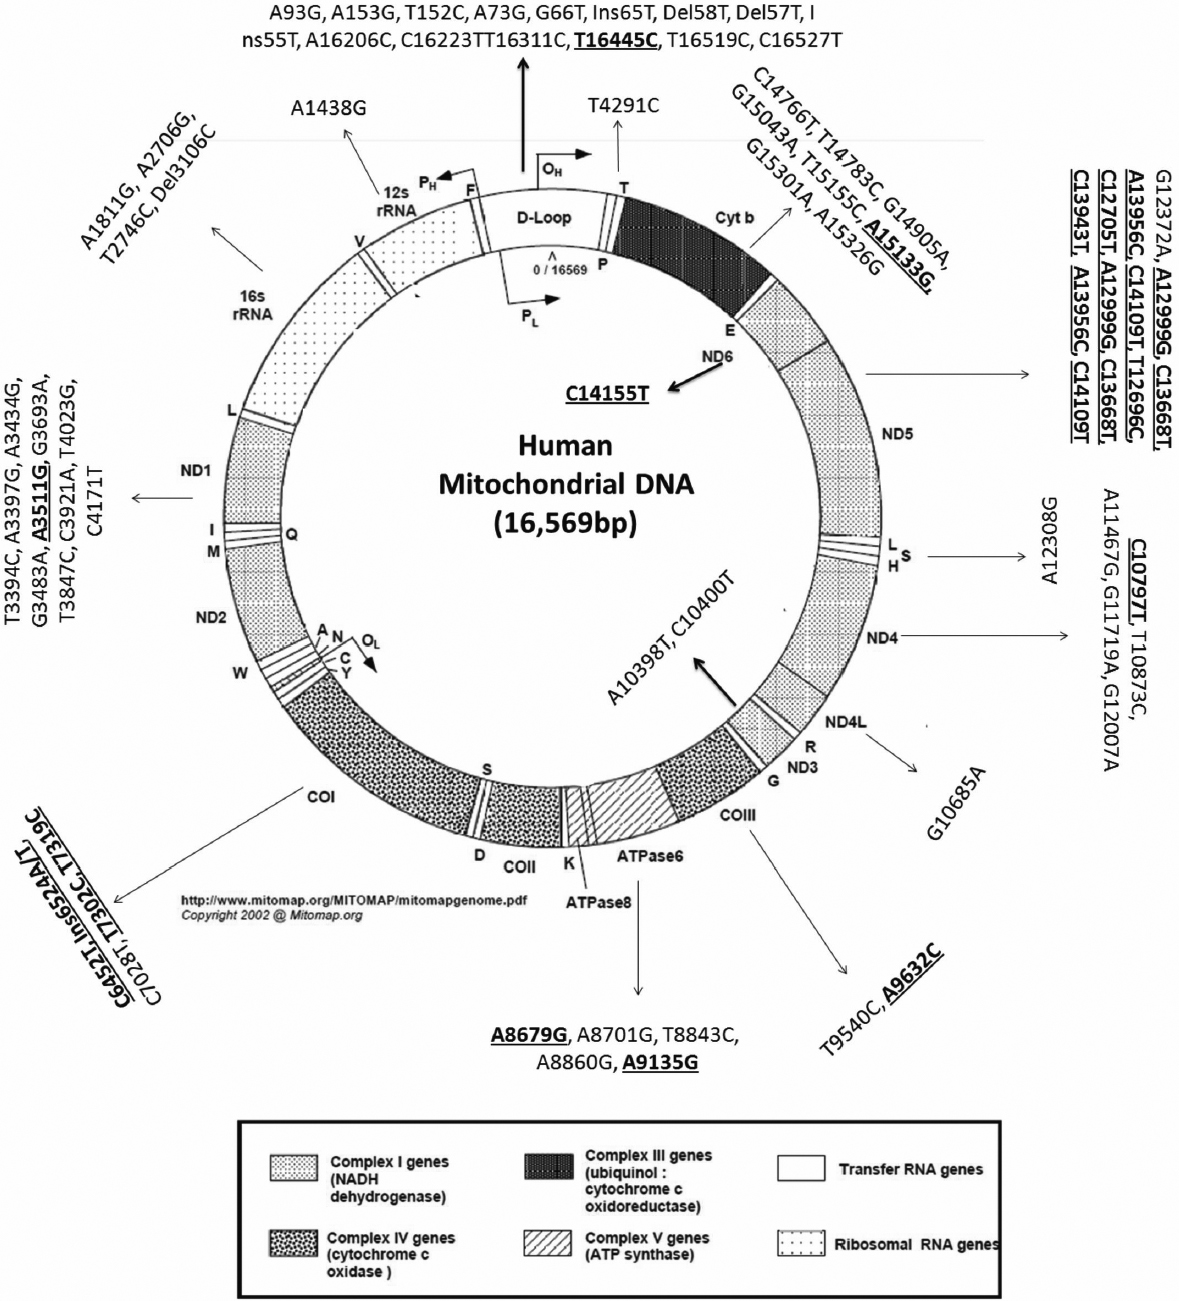
Figure 3. The distribution of mitochondrial sequence variations identified. The sequence variations identified in the coding and non-coding
regions of the mitochondria are shown by arrow heads. The D- loop showed highest number of variation followed by ND1 region
and Cytb. The novel mutations observed in inherited cataract families are highlighted in bold and underlined. The circular
mitochondrial genome map was retrieved from
mitomap.
 Figure 3 of
Roshan, Mol Vis 2012; 18:181-193.
Figure 3 of
Roshan, Mol Vis 2012; 18:181-193.