Figure 4. Wnt3a influences the proliferation and cell-cycle distribution of HLE cells. A: MTT assay showed that the OD at 490 nm values of Wnt3a-overexpressing cells increased compared with control cells, as determined
every 24 h for 5 days (p<0.05). B: Representative flow cytometry analysis demonstrated that a higher percentage of Wnt3a-overexpressing HLE B-3 cells were
in the S phase.
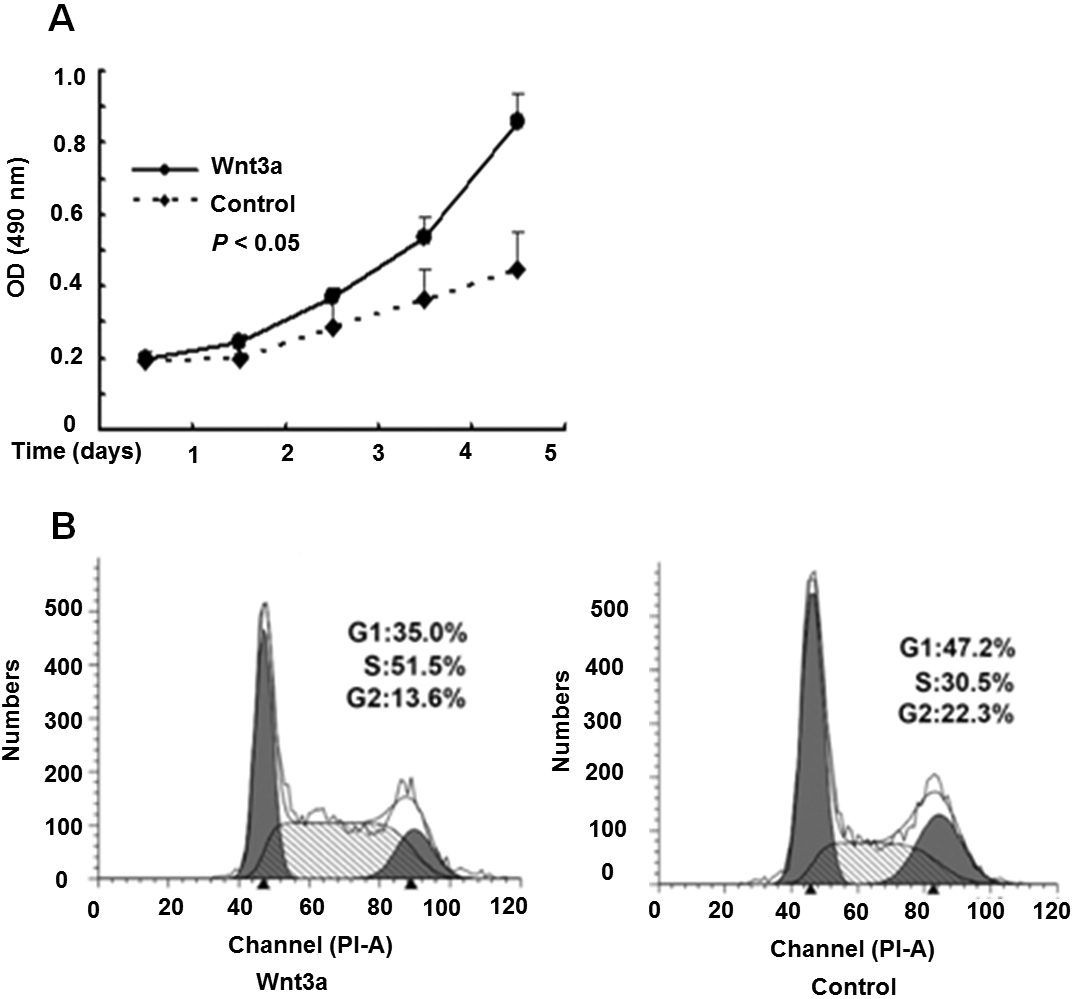
 Figure 4 of
Bao, Mol Vis 2012; 18:1983-1990.
Figure 4 of
Bao, Mol Vis 2012; 18:1983-1990.