Figure 2. Wnt3a induces the EMT of HLE B-3 cells. A: Wnt3a-overexpressing cells had an irregular shape, whereas control cells had a spindle-shaped morphology (original magnification
400×). B: western blot analysis detected down-regulated epithelial protein E-cadherin in Wnt3a-overexpressing HLE B-3 cells compared
with control cells. In contrast, the expression of mesenchymal protein fibronectin was upregulated in Wnt3a-overexpressing
cells. C: Immunocytofluorescence showed that the expression of E-cadherin protein (green) was down-regulated in Wnt3a-overexpressing
cells compared with control cells, whereas that of fibronectin (red) increased. DAPI (blue) was used for nuclear staining.
Merged images are shown in the right panel.
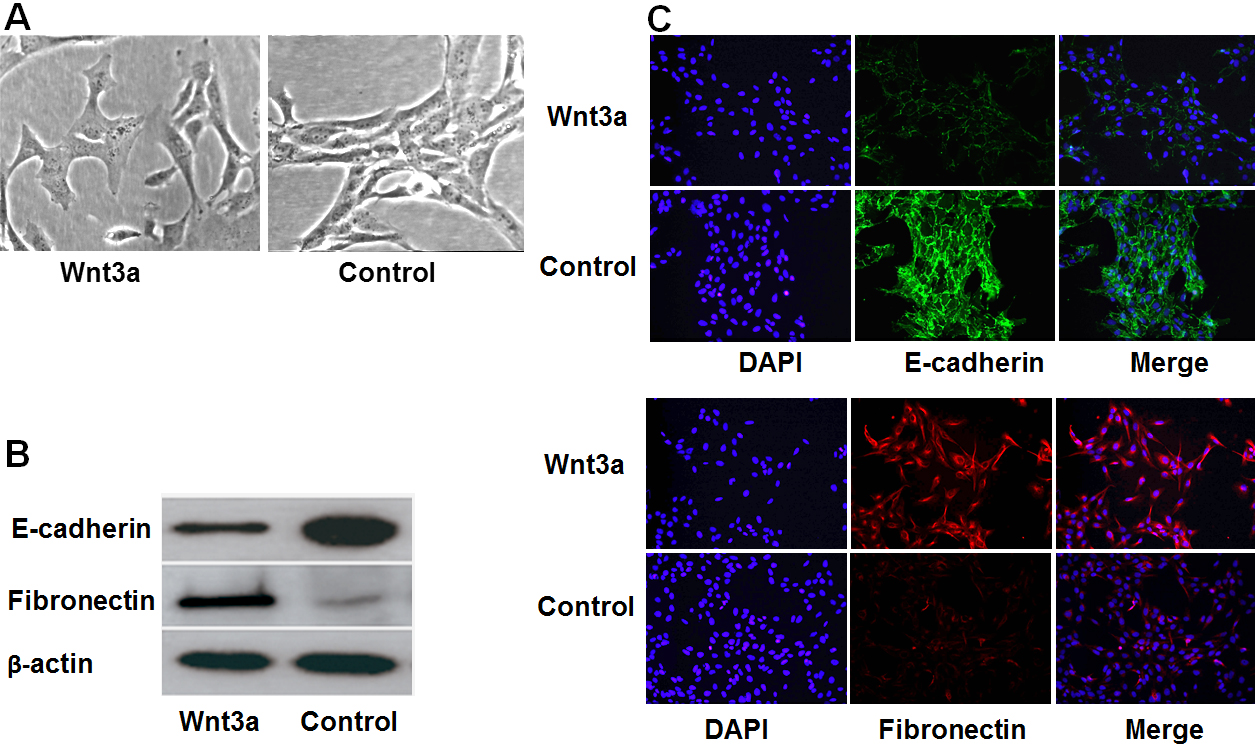
 Figure 2 of
Bao, Mol Vis 2012; 18:1983-1990.
Figure 2 of
Bao, Mol Vis 2012; 18:1983-1990.