Figure 7. Detection of FITC loaded by
CS/TCS-SA NPs in rat corneas. The rats were divided into 3
groups; FITC only, FITC-loaded CS-SA NPs, and FITC-loaded TCS-SA
NPs. FITC were topically treated for 1.5 h. A-C:
Representative images of stereomicroscope. D-F:
Representative images of CLSM of peripheral cornea. G-I:
Representative images of CLSM of central cornea. FITC displayed
green fluorescence and nuclei were counterstained with DAPI
(blue). Representative images from five individual animals are
shown.
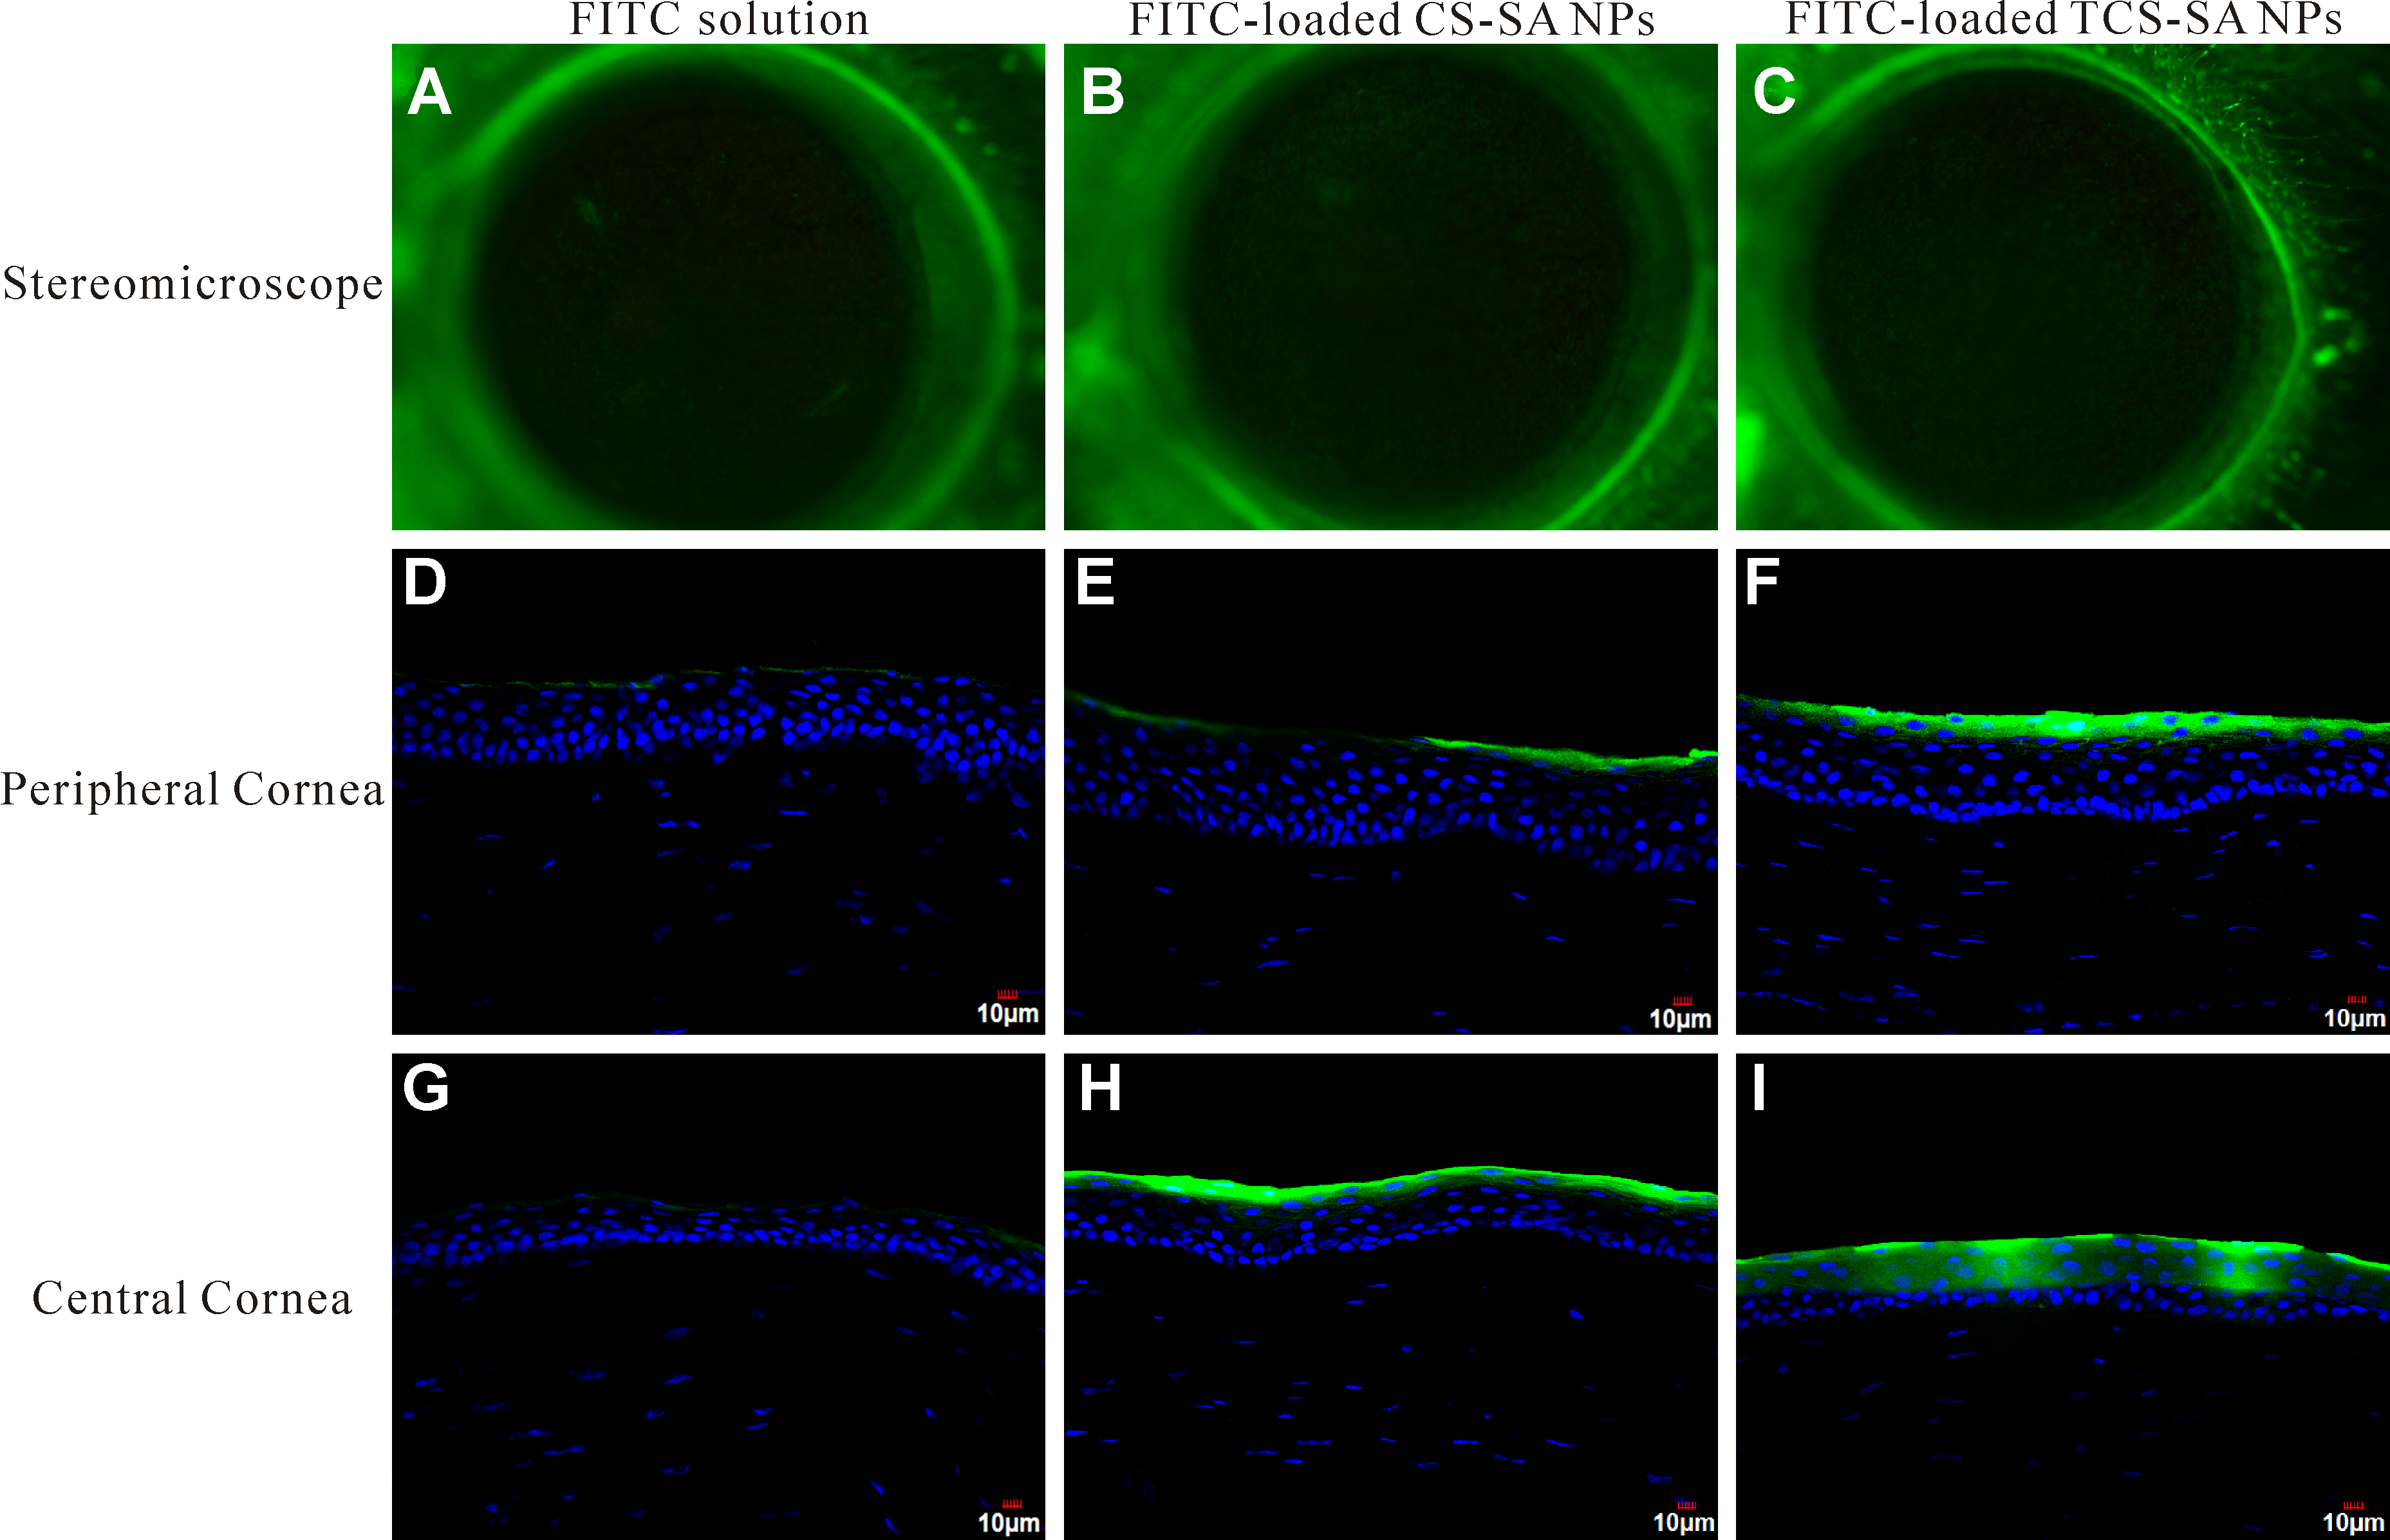
 Figure 7
of Zhu, Mol Vis 2012; 18:1973-1982.
Figure 7
of Zhu, Mol Vis 2012; 18:1973-1982.