Figure 6. Fluorescent images of HCE
cells incubated with same amount of FITC that loaded by
CS/TCS-SA NPs for 8 h. The appearance of fluorescence signal of
FITC (color of green) inside cells indicated the actual release
of FITC from NPs. It showed that the in vitro cell uptake degree
of NPs and TCS-SA NPs delivered much more FITC into cells than
CS-SA NPs (as the arrows showed). A: CS-SA NPs; B:
TCS-SA NPs (Scale bar: 100 μM).
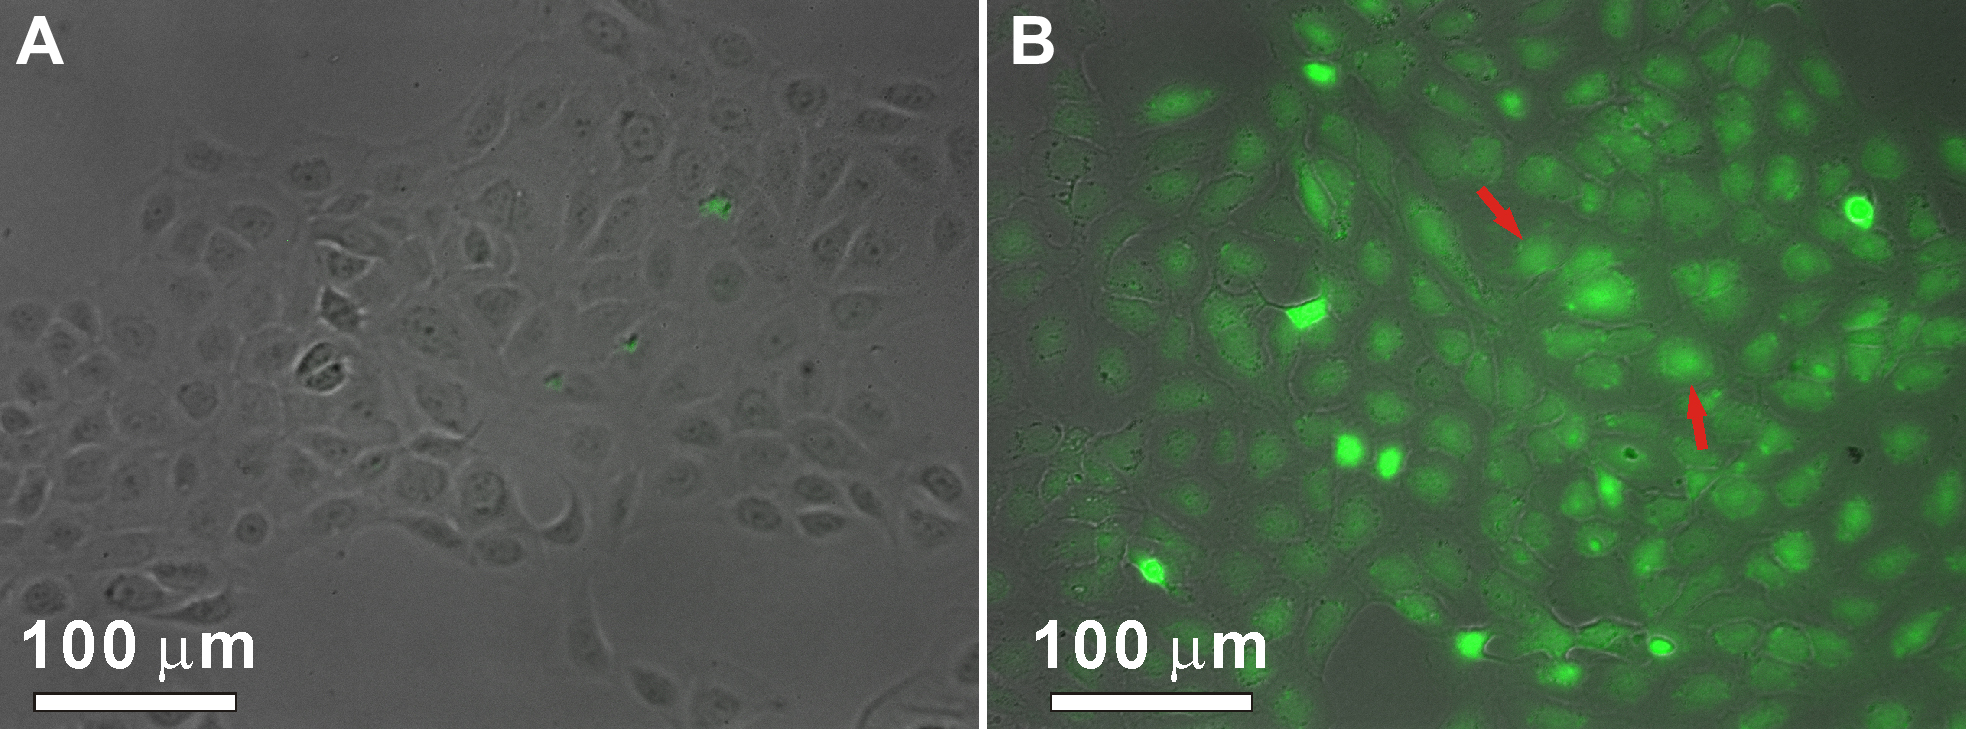
 Figure 6
of Zhu, Mol Vis 2012; 18:1973-1982.
Figure 6
of Zhu, Mol Vis 2012; 18:1973-1982.