Figure 4. SEM microphotographs showed
populations of spherical nanoparticles for both formulations
(CS/TCS: 0.5 mg/ml, SA: 0.625 mg/mL). A: FITC-loaded
CS-SA NPs; B: FITC-loaded TCS-SA NPs. Regular surfaces
could be observed for both formulations and no important
differences were denoted between the different formulations
analyzed.
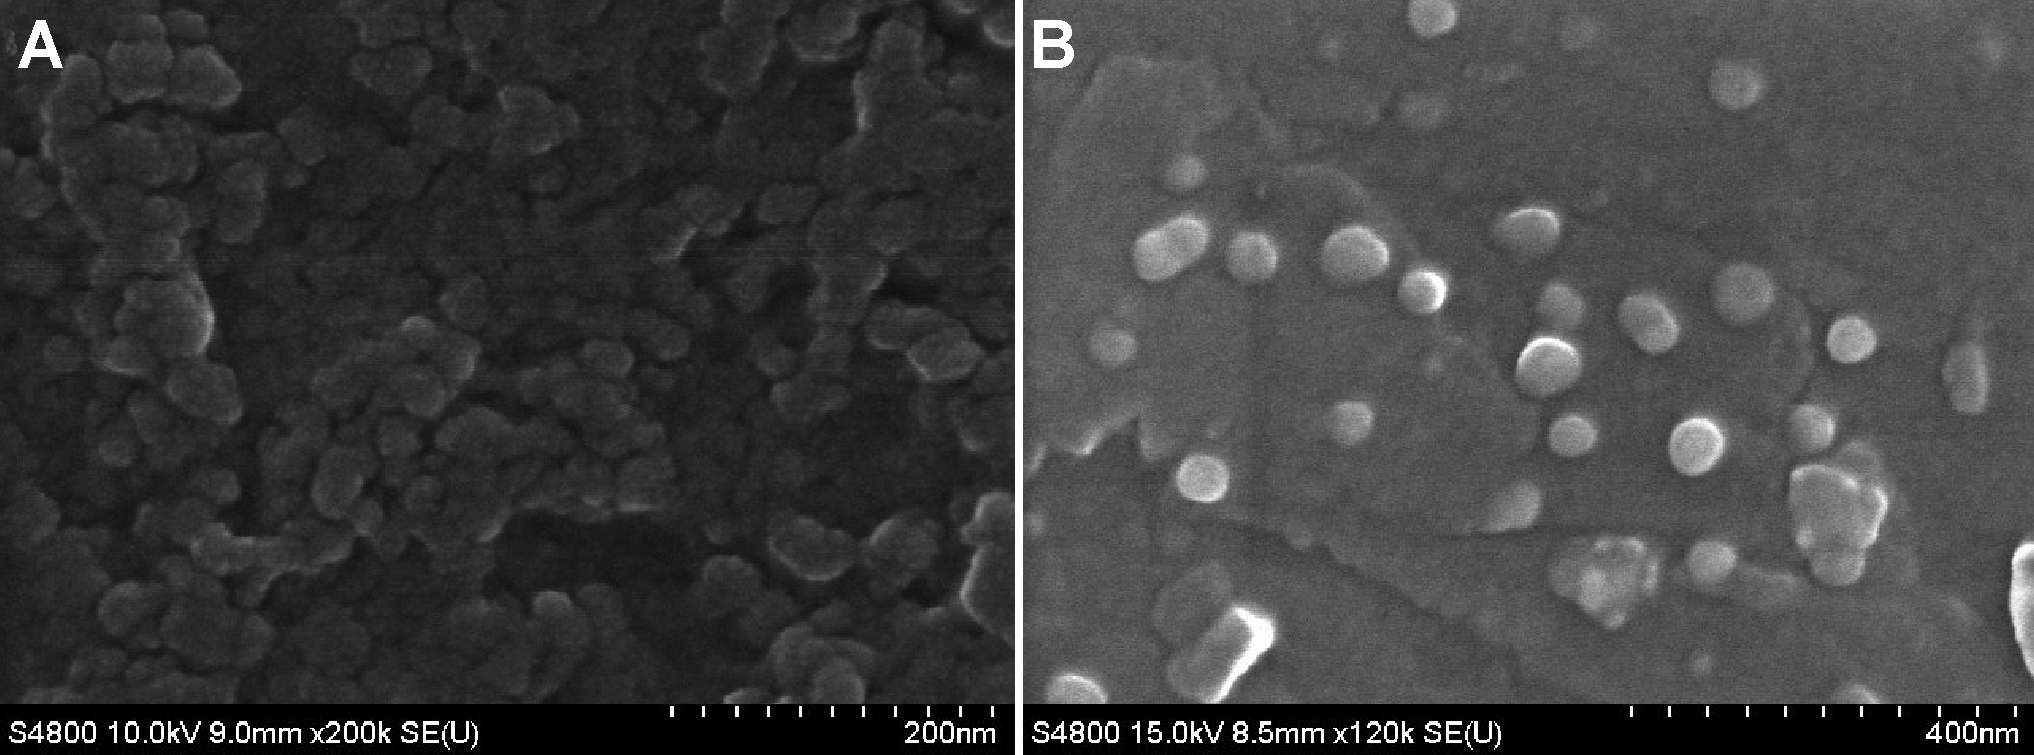
 Figure 4
of Zhu, Mol Vis 2012; 18:1973-1982.
Figure 4
of Zhu, Mol Vis 2012; 18:1973-1982.