Figure 2. The association of CYP1A1 allelic variants, protein expression and Bap-like DNA adduct levels in PEC cells. A: The representative CYP1A1 protein expression in PEC cells with different CYP1A1 genotypes. B: BPDE-like DNA adduct levels in PEC cells detected by ELISA. Data showed that PEC cells with m1/m2 and m2/m2 genotypes were
significantly higher than in the cells with m1/m1 genotype.
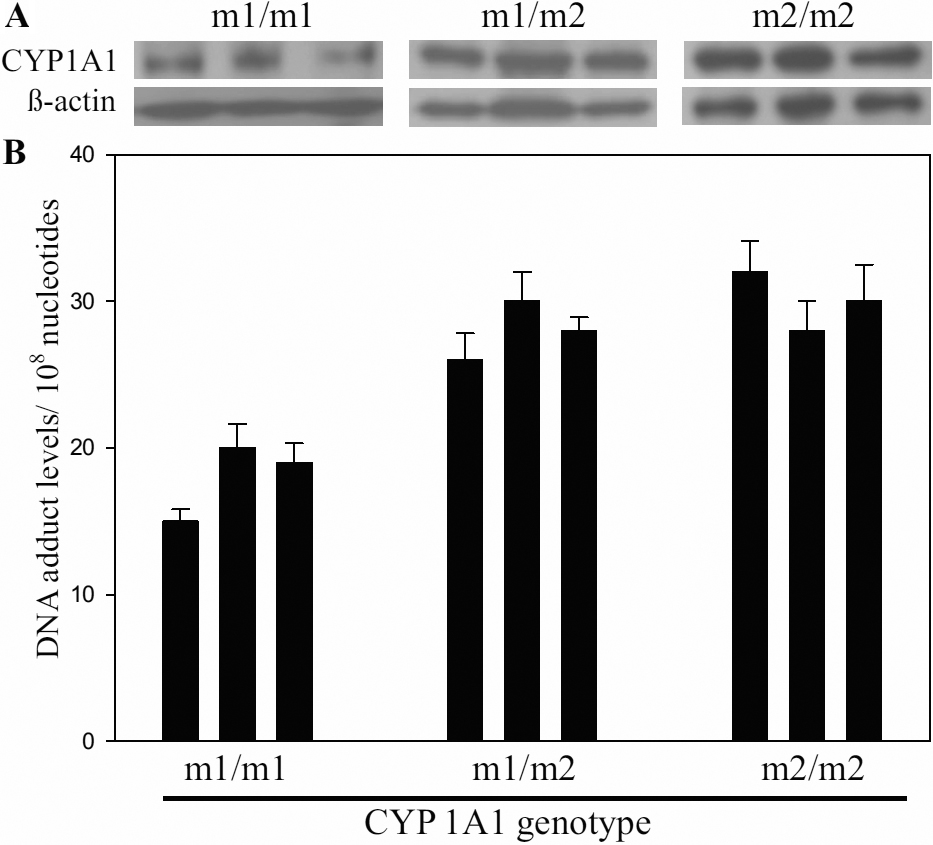
 Figure 2 of
Peng, Mol Vis 2012; 18:1937-1943.
Figure 2 of
Peng, Mol Vis 2012; 18:1937-1943.