Figure 8 of
Weisschuh, Mol Vis 2012; 18:174-180.
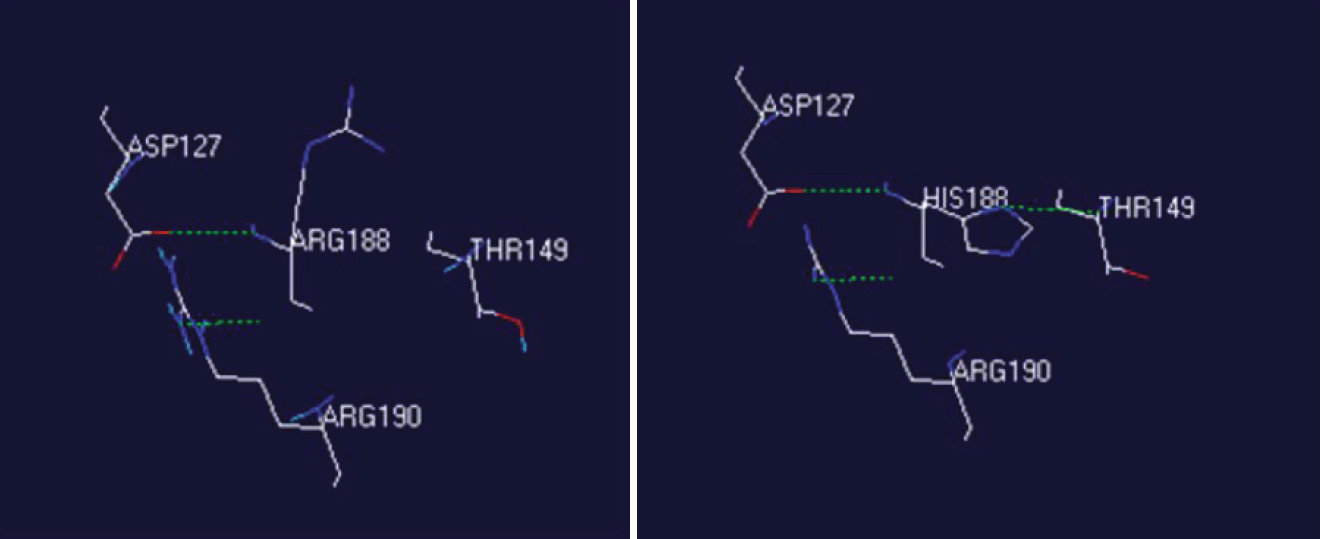
Figure 8.
Molecular modeling of the effect of mutation p.Arg188His. Hydrogen-bonding patterns of the normal βB2-crystallin (left) and the mutant βB2-crystallin (right) are shown by dashed lines (green).
 Figure 8 of
Weisschuh, Mol Vis 2012; 18:174-180.
Figure 8 of
Weisschuh, Mol Vis 2012; 18:174-180.