Figure 5. Restriction fragment length analysis showing gain of an ApaLI site that cosegregates only with affected family members heterozygous
for the c.563G→A transition. Control subjects were analyzed accordingly (data not shown). M, size marker (100 bp ladder, NEB).
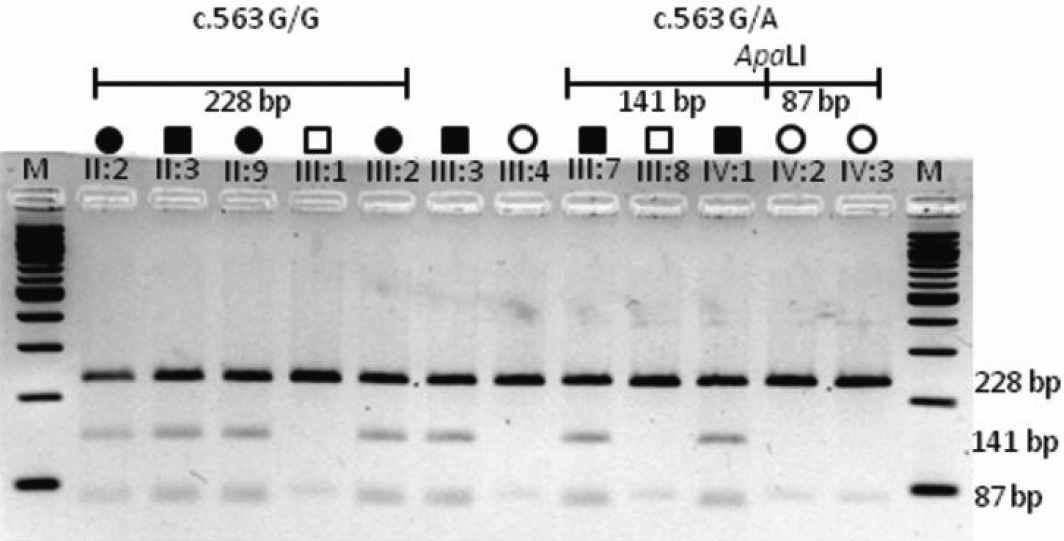
 Figure 5 of
Weisschuh, Mol Vis 2012; 18:174-180.
Figure 5 of
Weisschuh, Mol Vis 2012; 18:174-180.