Figure 3. Dose response curve showing
the effect of hexadecyloxypropyl cytarabine 3’,5’-cyclic
monophosphate (HDP-cP-Ara-C) and hexadecyloxypropyl cytarabine
5’-monophosphate (HDP-P-Ara-C)on human retinal pigment
epithelium (ARPE-19) cells and rat Müller (rMC-1) cells
proliferation. The y-axis represents the fraction of mean
optical density (OD) values of testing wells for the compounds
by the mean OD values of the cells for medium control using
WST-1 or XTT cell proliferation assay.
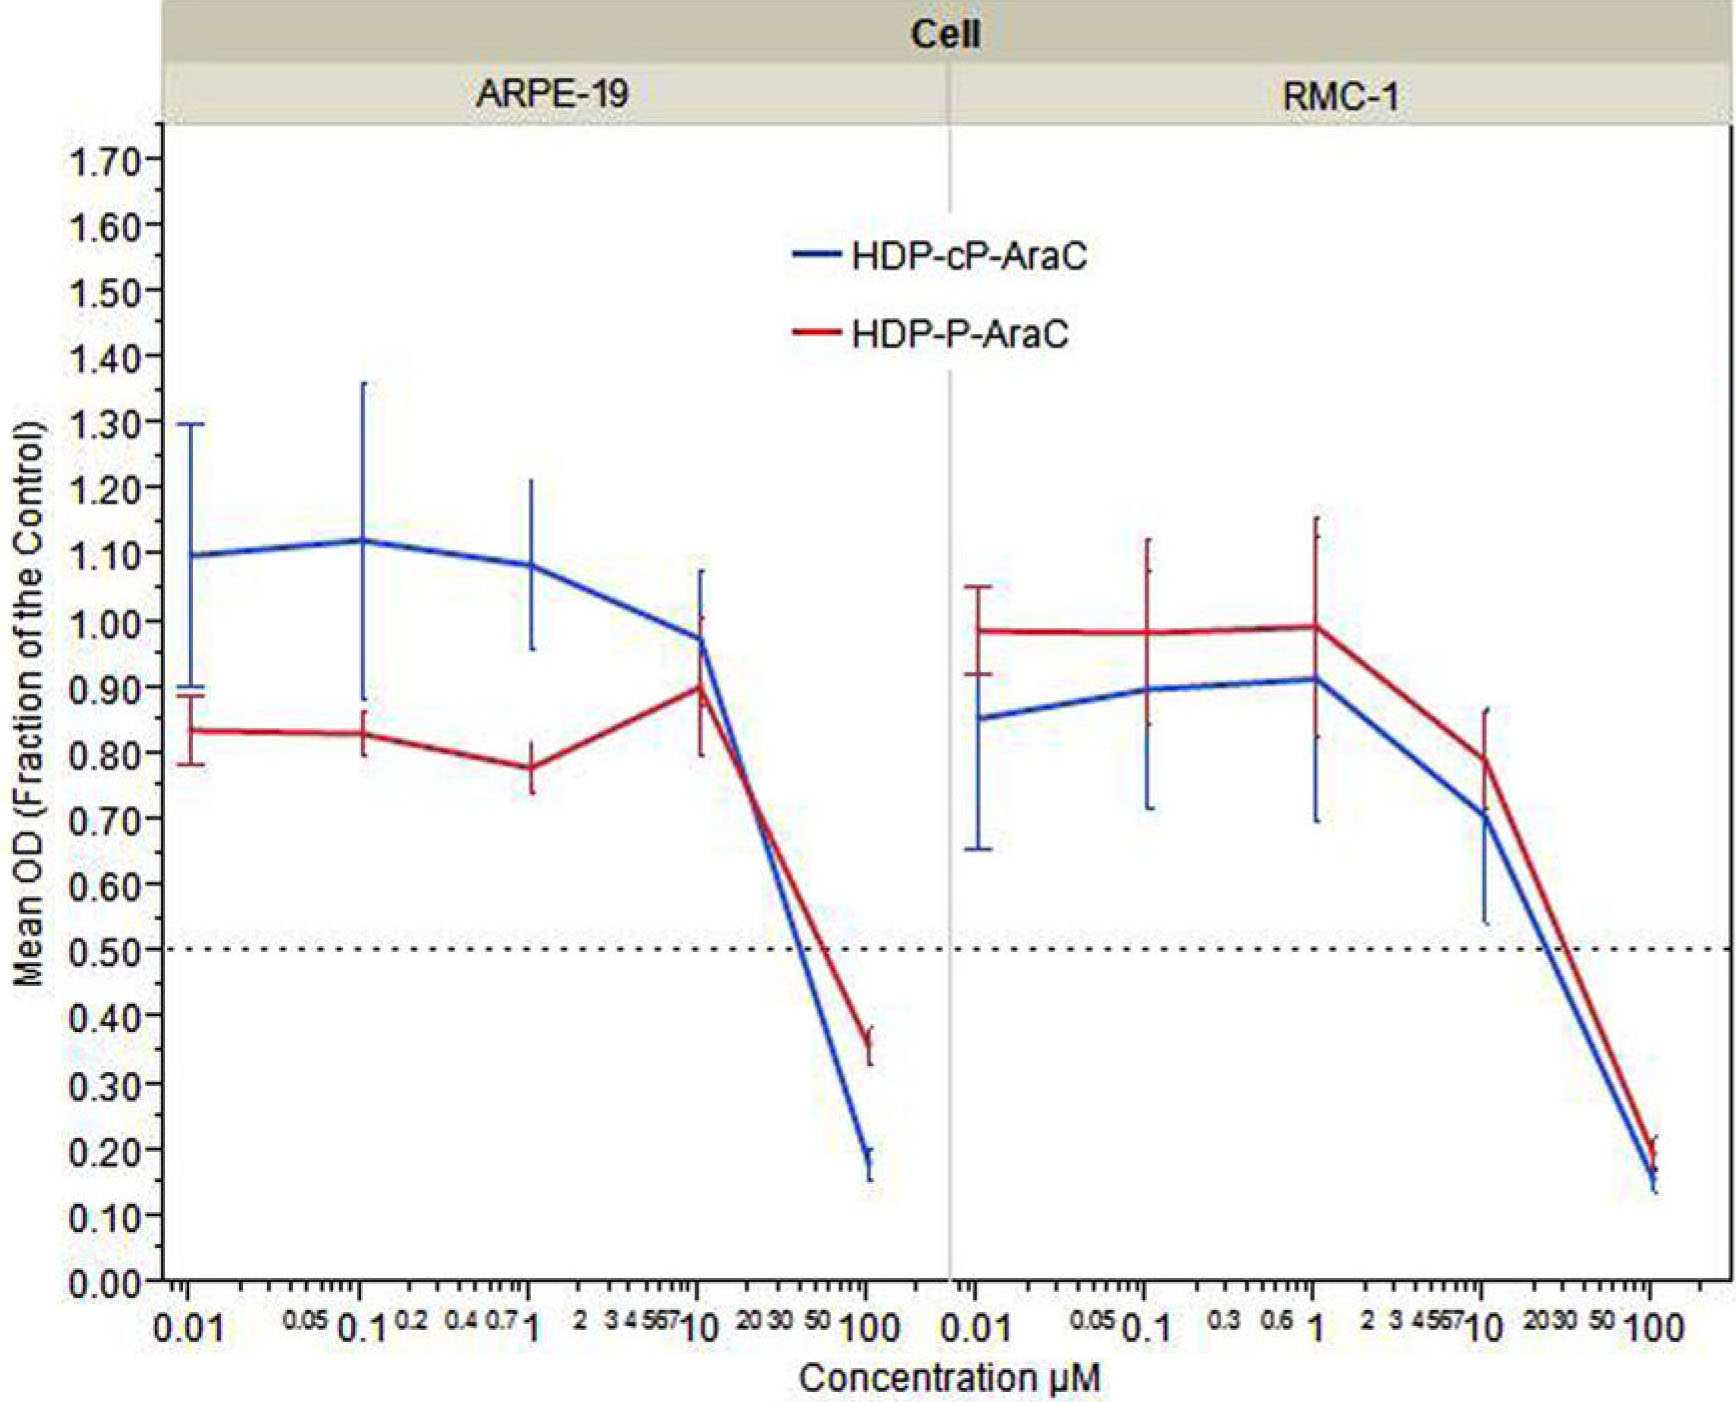
 Figure 3
of Kim, Mol Vis 2012; 18:1907-1917.
Figure 3
of Kim, Mol Vis 2012; 18:1907-1917.