Figure 2. Audiometry. Audiological
evaluation of Patient 1 (A), Patient 2 (B), and
Patient 3 (C) shows the hearing thresholds at all tested
frequencies pre- and post-cochlear implantation. Pure tone sound
field audiograms are represented by unaided (S), Aided (A), and
Implanted (I). “O” and “X” symbols correspond to the right and
left ear pure tone air conduction audiograms, respectively.
Audiometric measurements were obtained at specific ages for each
patient as denoted by each hearing assessment. All three
affected individuals had bilateral profound sensorineural
hearing loss before cochlear implantation. Post-implantation,
all affected acquired hearing threshold measurements in the
normal range.
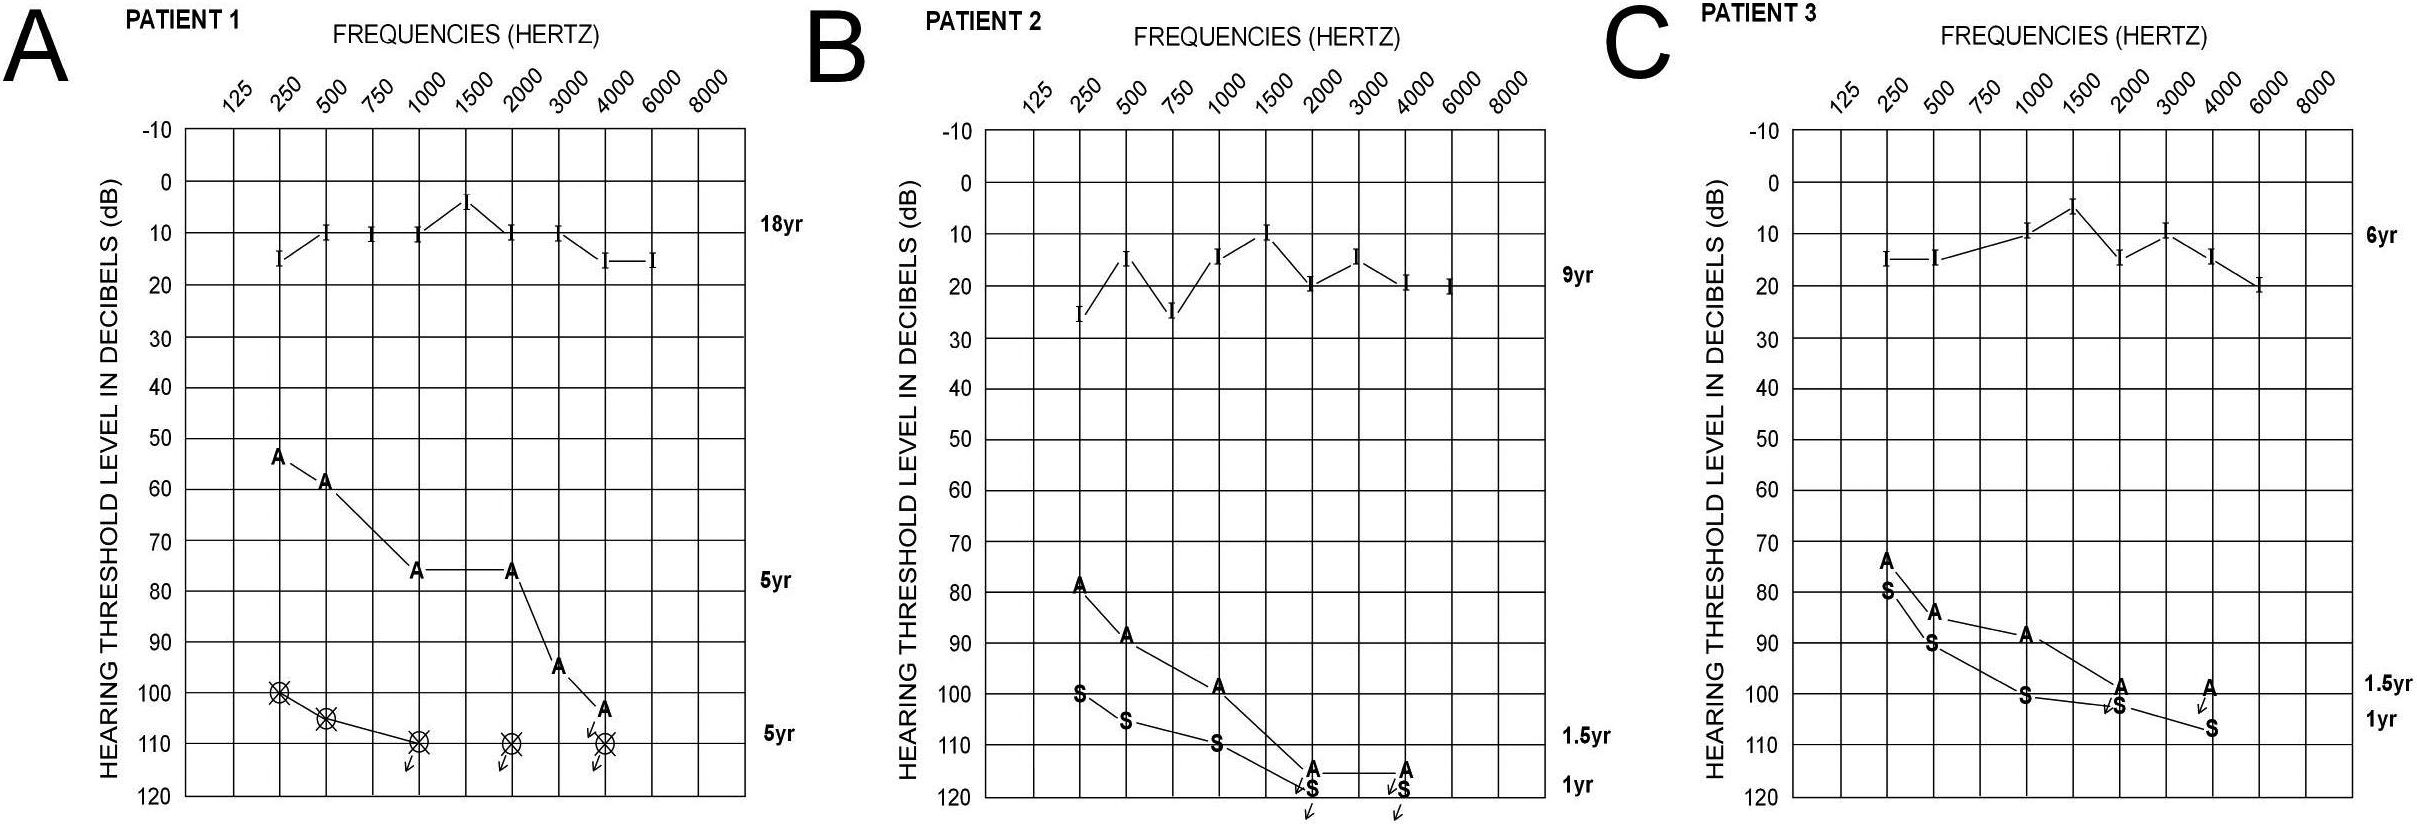
 Figure 2
of Imtiaz, Mol Vis 2012; 18:1885-1894.
Figure 2
of Imtiaz, Mol Vis 2012; 18:1885-1894.