Figure 5. Two-dimensional tiled image showing a section through the sclera to the conjunctiva. The sclera (S) emits predominately SHG
signal (green) while the conjunctiva (C) is visible by 2PAF (red). In this image, individual cells within the conjunctiva
(see arrow) can be clearly resolved by their intrinsic autofluorescence from endogenous cofactors such as NAD(P)H and FAD.
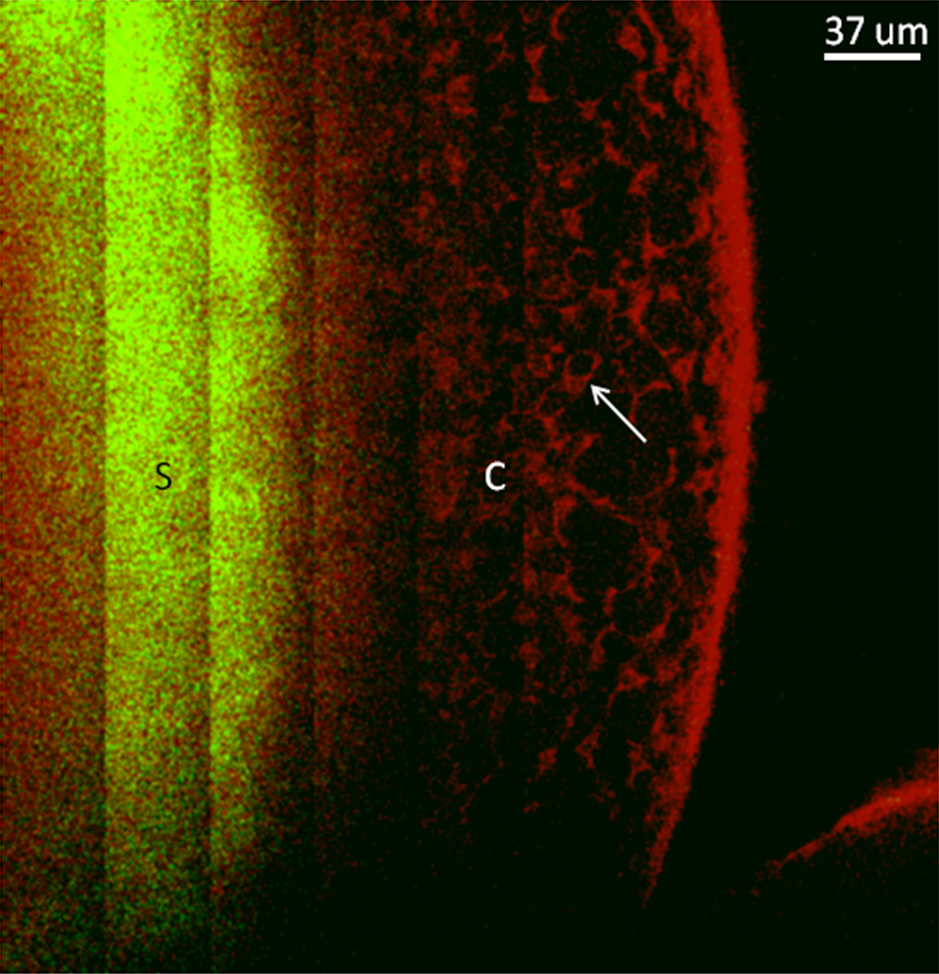
 Figure 5 of
Masihzadeh, Mol Vis 2012; 18:1840-1848.
Figure 5 of
Masihzadeh, Mol Vis 2012; 18:1840-1848.