Figure 8. Western blot analysis. The diversity of the growth factor and keratin determined at the protein level (A). Ratio of different factors to β-actin (B). Values are expressed as mean±SEM (n=6, six samples from ADM sheet with two types of seeded cells for the seeded groups;
six samples from normal cultured cells in 24-well board for the normal cultured groups, p<0.05). Abbreviations: LSCs represents
limbal stem cells; MSCs represents bone marrow deserved mesenchymal stem cells; LSCs-A represents LSCs seeded on the ACM;
MSCs-A represents MSCs seeded on the ACM.
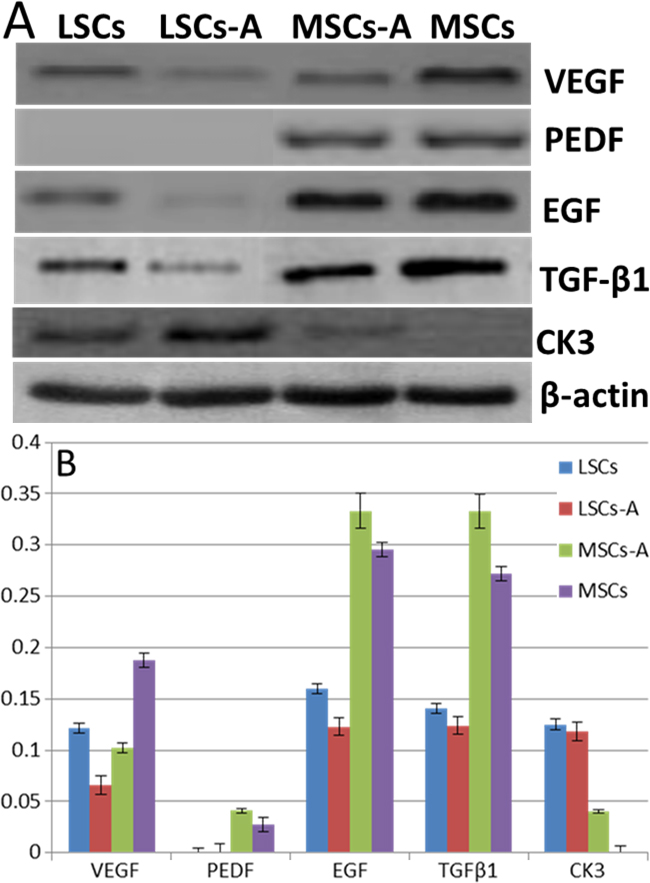
 Figure 8 of
Zhang, Mol Vis 2012; 18:161-173.
Figure 8 of
Zhang, Mol Vis 2012; 18:161-173.