Figure 2. Mass spectra transformed to
the mass scale of α-crystallins. The vertical and horizontal
axes correspond to the relative protein abundance and m/z,
respectively. The expected cleavage fragments and [measured mass
values in MALDI-TOF spectra (Da)/theoretical value (Da)] are
indicated. Spectra were acquired for each sample in which
digestion by endoproteinase Asp-N was quenched at 0 min (not
digested), 10 min, 30 min, 1 h, 3 h, and 24 h. A: Human
αA-crystallin. B: Human αB-crystallin.
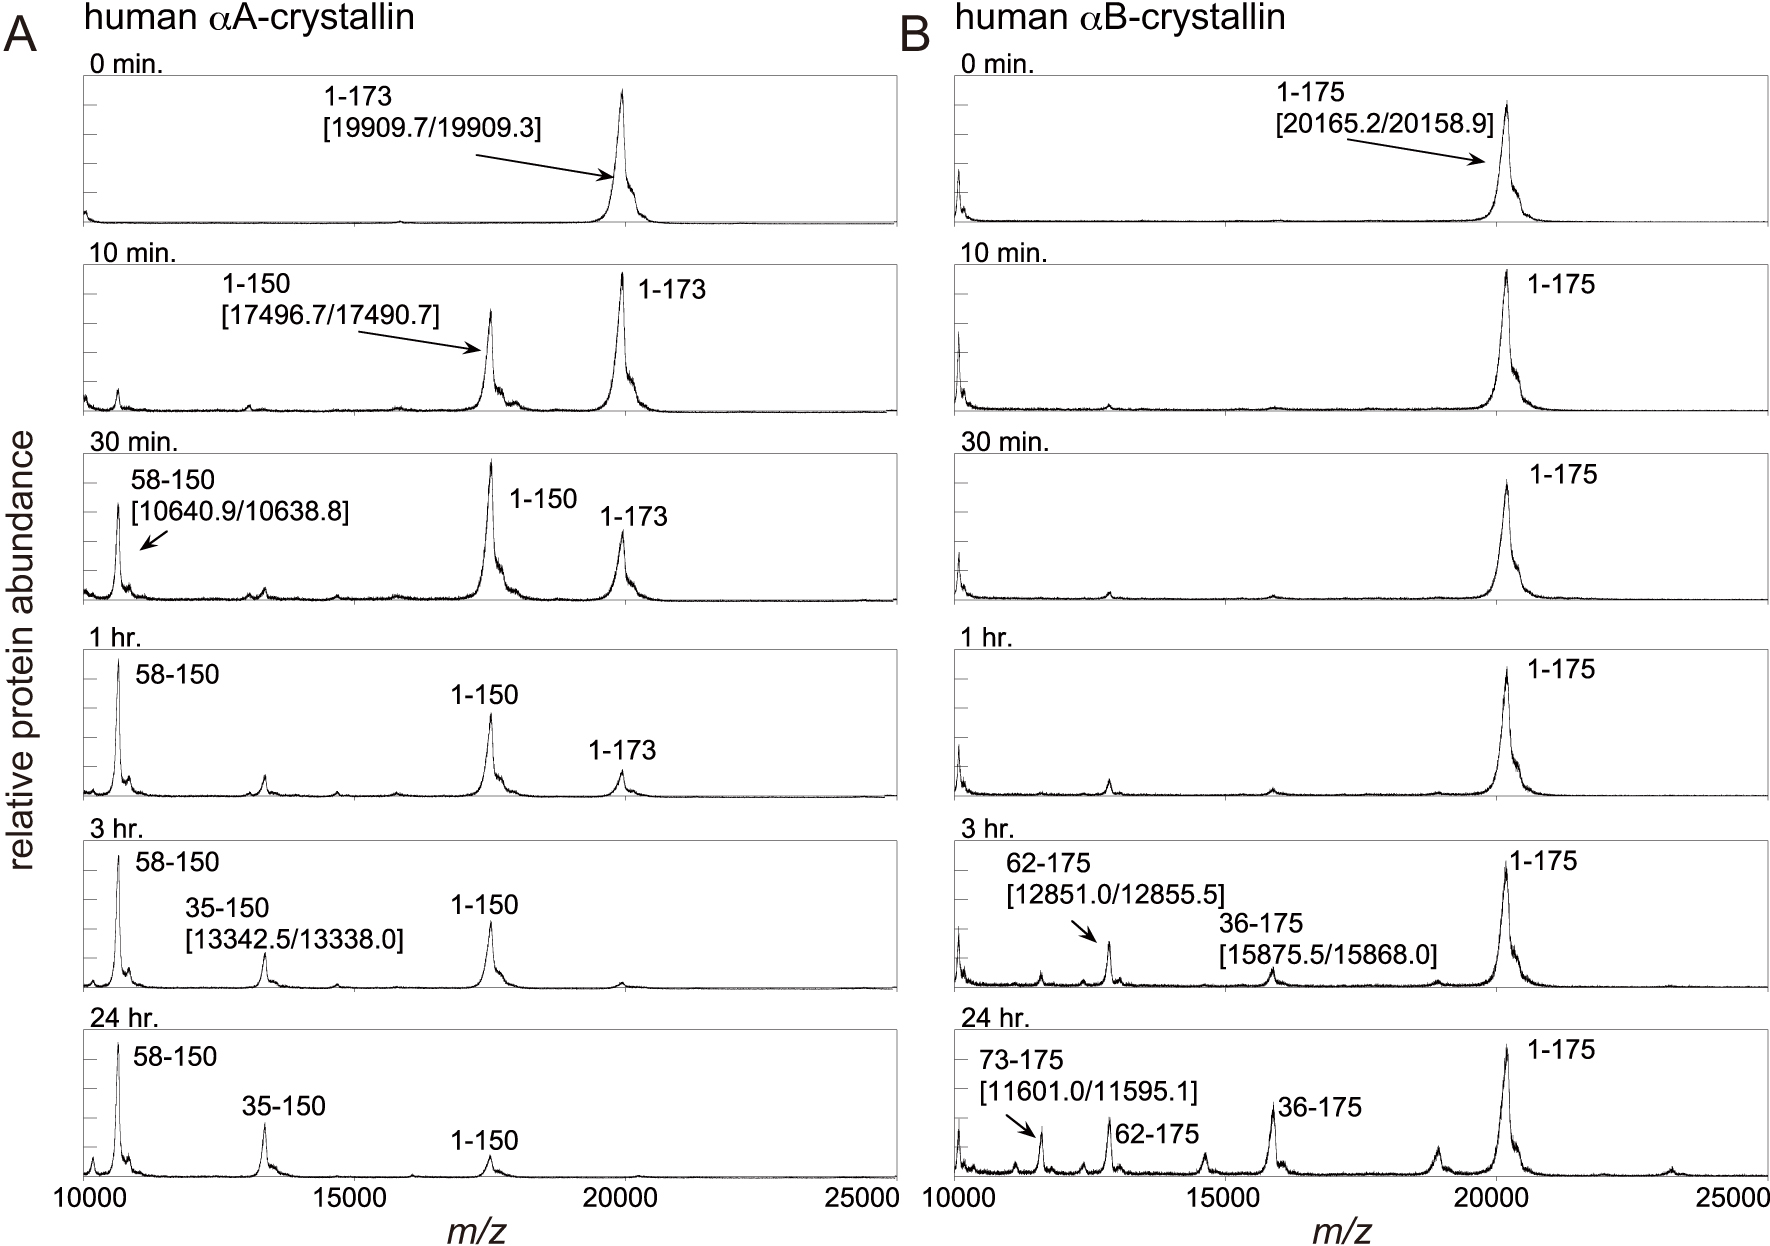
 Figure 2
of Shimizu, Mol Vis 2012; 18:1823-1827.
Figure 2
of Shimizu, Mol Vis 2012; 18:1823-1827.