Figure 4. Expression of stem cell
markers in UM. ABCG2 (middle panel) and OCT4 (right panel)
protein expression was assessed by indirect immunofluorescence
in a mixed UM primary tumor. Positive staining appears in red.
Nuclei were counterstained using Hoechst (in blue). No positive
staining was observed in the negative control section using
mouse IgG (left panel). Scale bars, 50 μm.
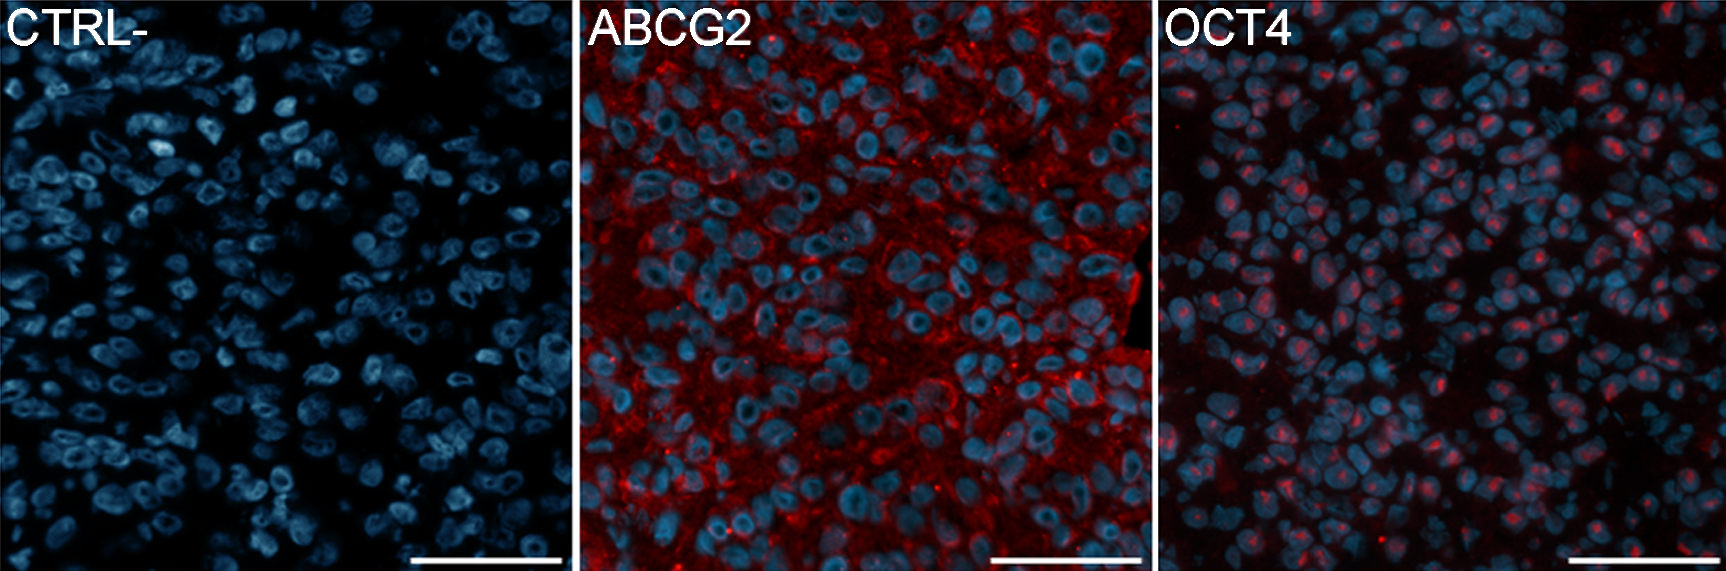
 Figure 4
of Bergeron, Mol Vis 2012; 18:1813-1822.
Figure 4
of Bergeron, Mol Vis 2012; 18:1813-1822.