Figure 3. Validation of
differentially expressed genes identified by the subtracted cDNA
library and confirmed by microarray gene expression profiling. A:
The mRNA expression level of selected genes down-regulated in UM
(ADAM10, CALU, CTNNB1, DCT, PGCP,
RAB27A, TRPM1, and TYRP1) was measured by
semi-quantitative RT–PCR in pools of RNA from UVM and uncultured
UM primary tumors (UM). The 18S RNA was used as an internal
control of amplification (489 bp). B: Band density ratio
calculated from A panels. 18S RNA band density was used for
internal normalization, and ratio was calculated by dividing
normalized values of UM by UVM.
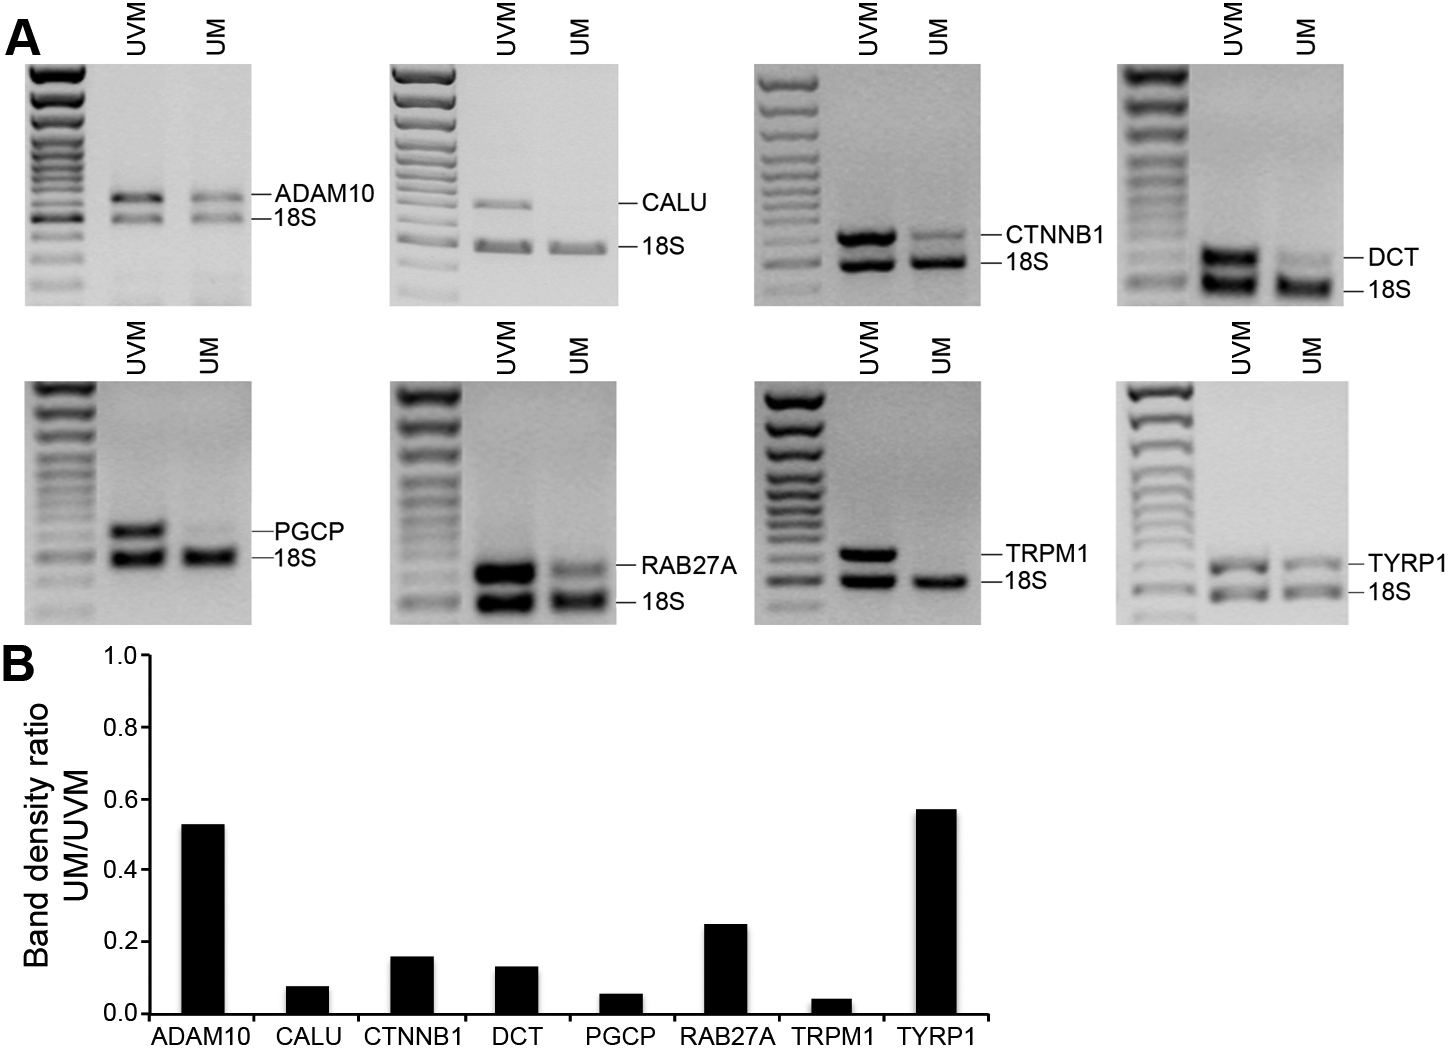
 Figure 3
of Bergeron, Mol Vis 2012; 18:1813-1822.
Figure 3
of Bergeron, Mol Vis 2012; 18:1813-1822.