Figure 2. Hierarchical clustering of
the top 15 differentially expressed genes identified by the SSH
technique and validated by microarray. UVM gene expression
profile was compared to those of UM primary tumors with good (UM
I) or bad prognosis (UM II). The color scale above the heat map
diagram illustrates the relative expression level of mRNAs (log2
expression): red color represents a high expression level; blue
color represents a low expression level.
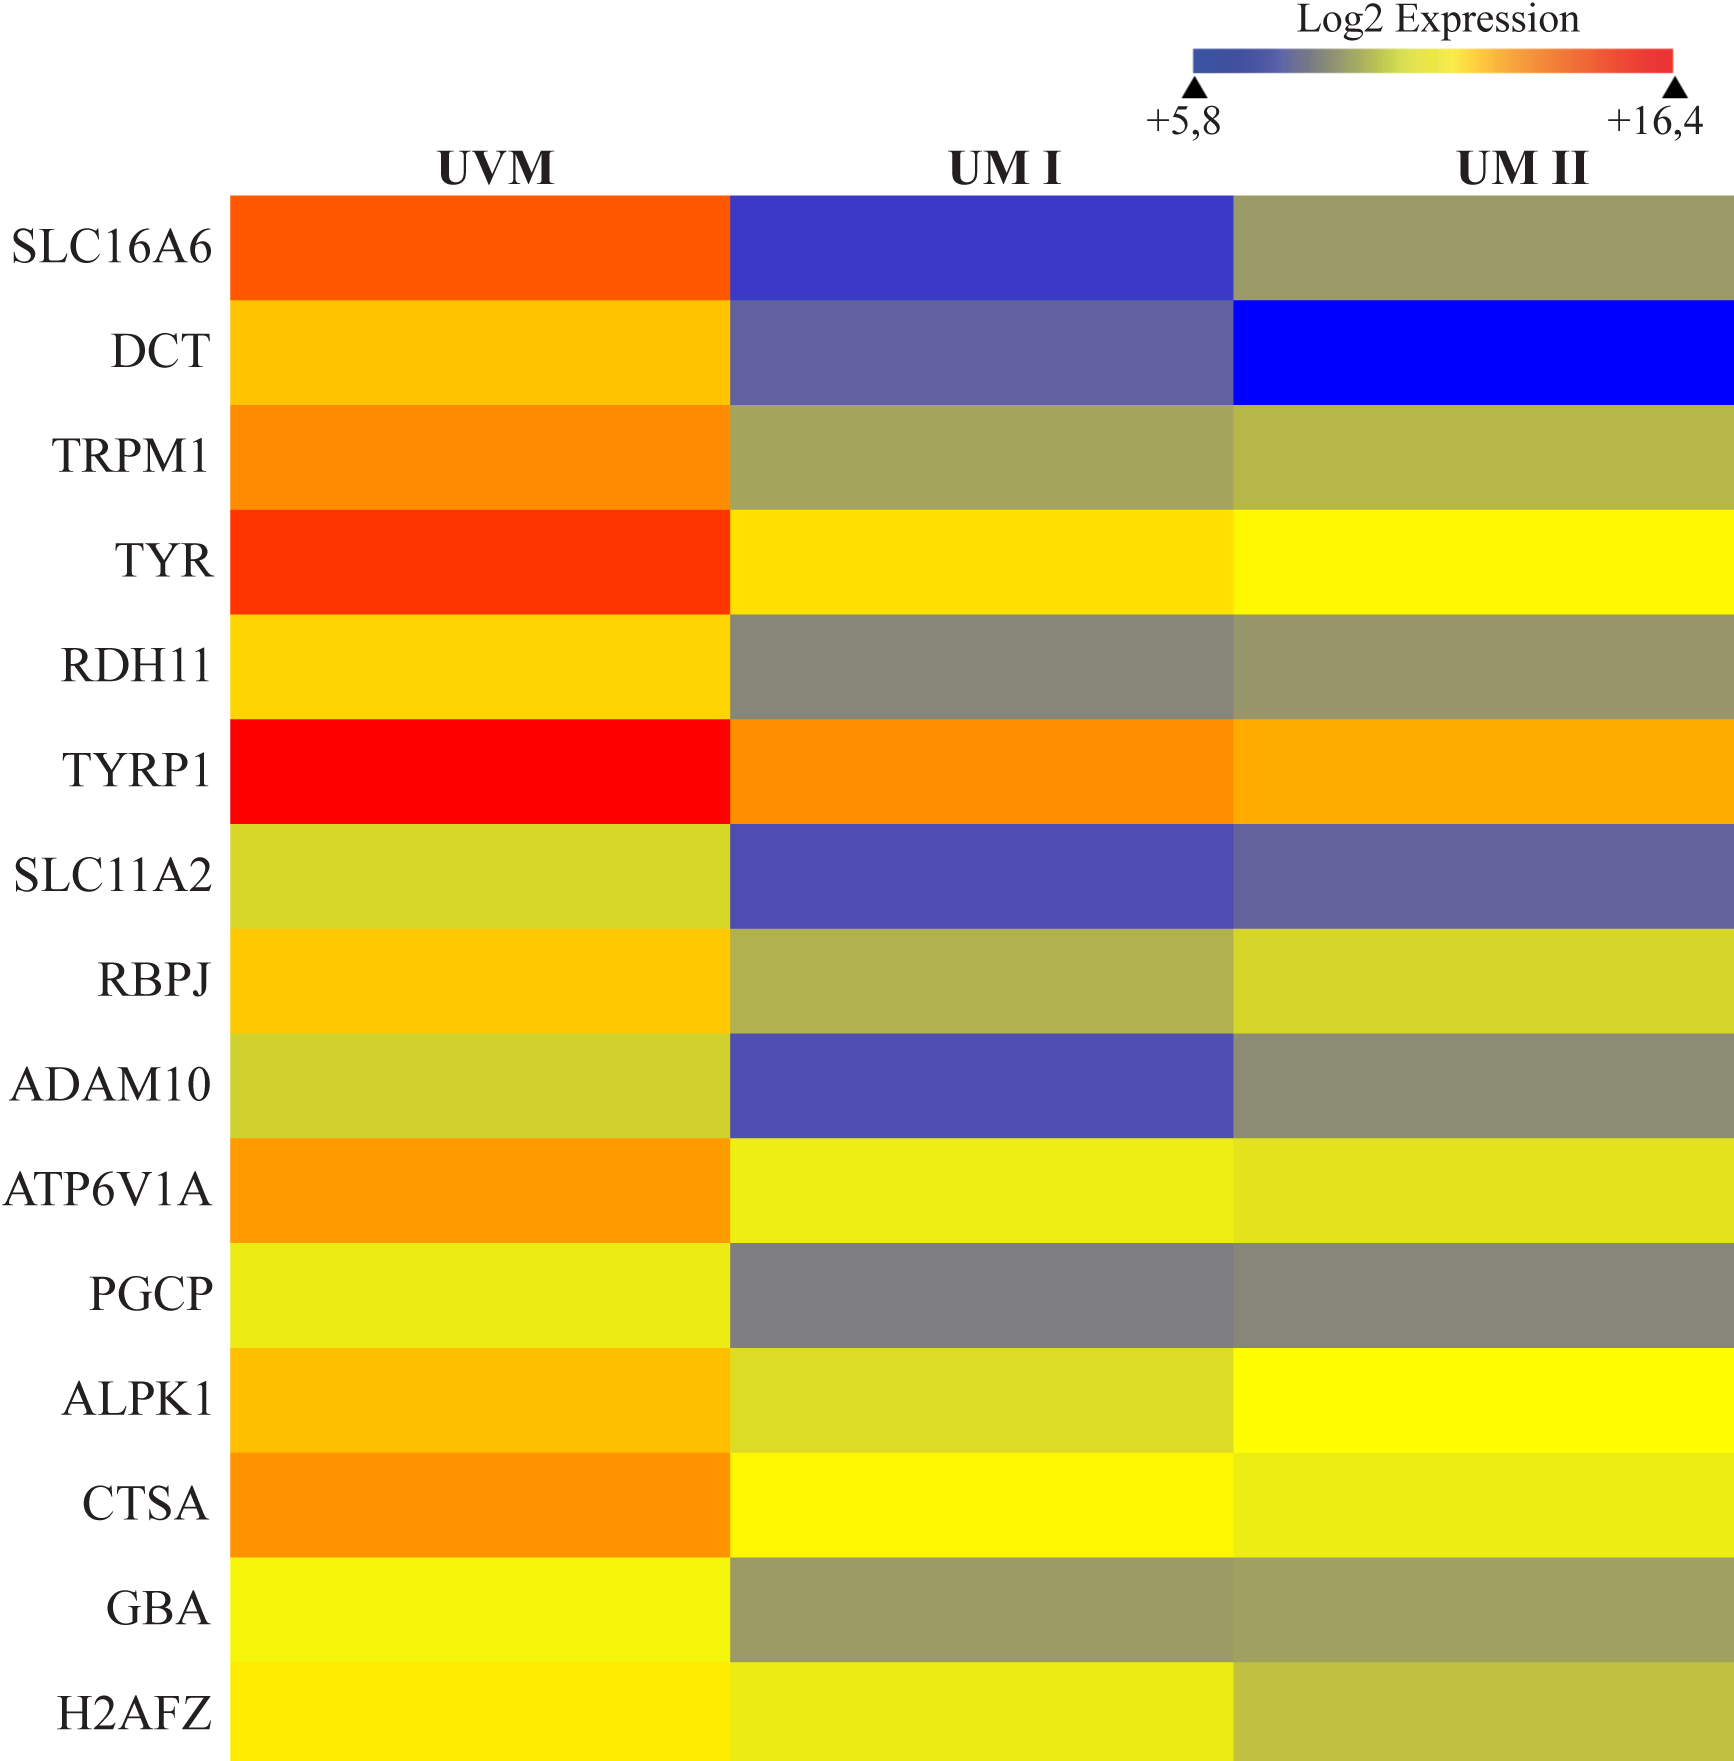
 Figure 2
of Bergeron, Mol Vis 2012; 18:1813-1822.
Figure 2
of Bergeron, Mol Vis 2012; 18:1813-1822.