Figure 3. LC3B levels in serum starved human lens epithelial cells. A: LC3B levels in lens epithelial HLEB3 cells exposed to serum starvation and chloroquine (50 µM) detected by immunoflourescent
confocal imaging (green). The nucleus is shown by DAPI staining (blue). B: Mean number of LC3B puncta are shown for each treatment (n=50 cells; error bars represent standard deviations). The data
are statistically significant at p<0.001 by Tukey analysis.
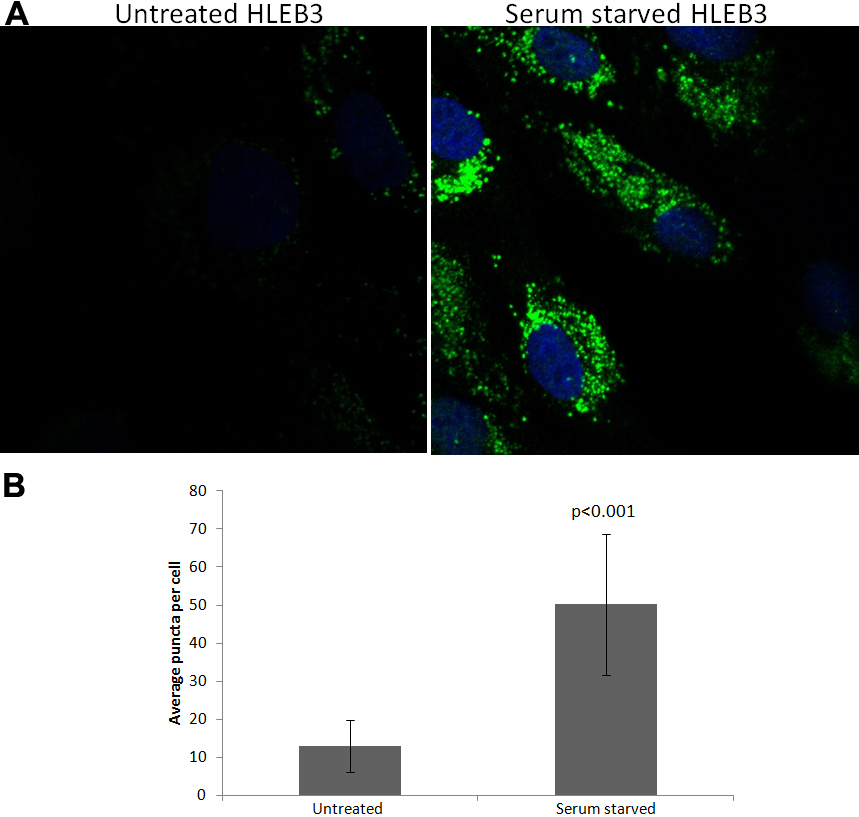
 Figure 3 of
Brennan, Mol Vis 2012; 18:1773-1786.
Figure 3 of
Brennan, Mol Vis 2012; 18:1773-1786.