Figure 1. Expression of autophagy genes in lens epithelium and fibers. A: Histogram representation of microarray gene expression data. Data were normalized to the levels of GAPDH (glyceraldehyde-3-phophate dehydrogenase), PGK (phosphoglycerate kinase), and TRP (trieosphate isomerase). B: Autophagy gene expression in separately isolated human lens epithelium and fiber cells by semi-quantitative RT–PCR. C: Autophagy protein levels of indicated proteins in microdissected human lens epithelium and fiber cells.
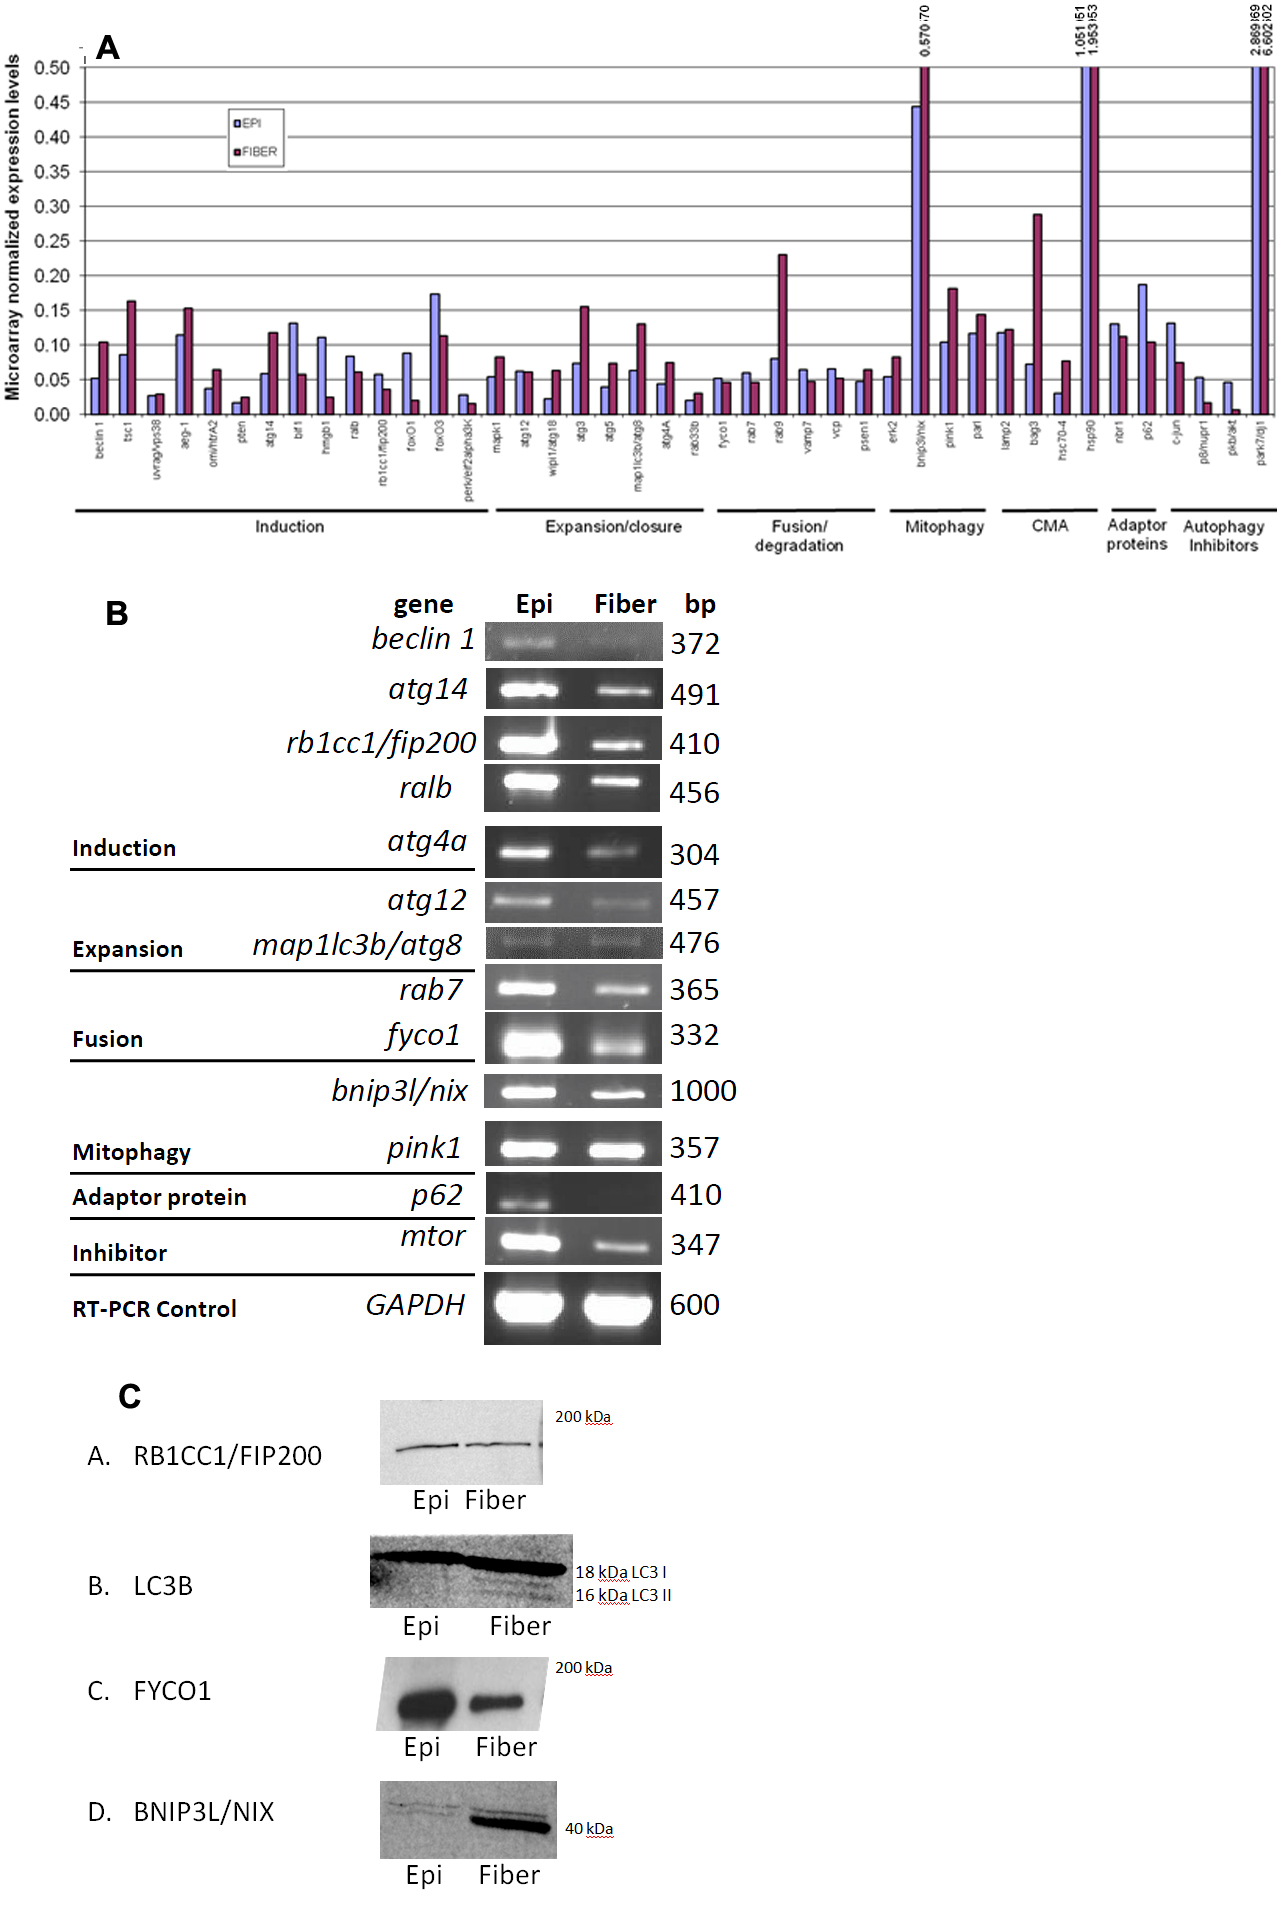
 Figure 1 of
Brennan, Mol Vis 2012; 18:1773-1786.
Figure 1 of
Brennan, Mol Vis 2012; 18:1773-1786.