Figure 3. Activities of antioxidant
enzymes in lenticular samples. A: Activity of SOD in
lens. B: Activity of CAT in lens. C: Activity of
Gpx in lens. D: Activity of GR in lens. E:
Activity of GST in lens. Group I: Control. Group II:
Selenite-supplemented. Group III: Selenite- supplemented + UDCA
treated. Values are expressed as mean±SD. Statistics of the data
used one-way ANOVA followed by the least significant difference
(LSD) test. * Compared with Group I: p<0.05. #
Compared with Group II: p<0.05.
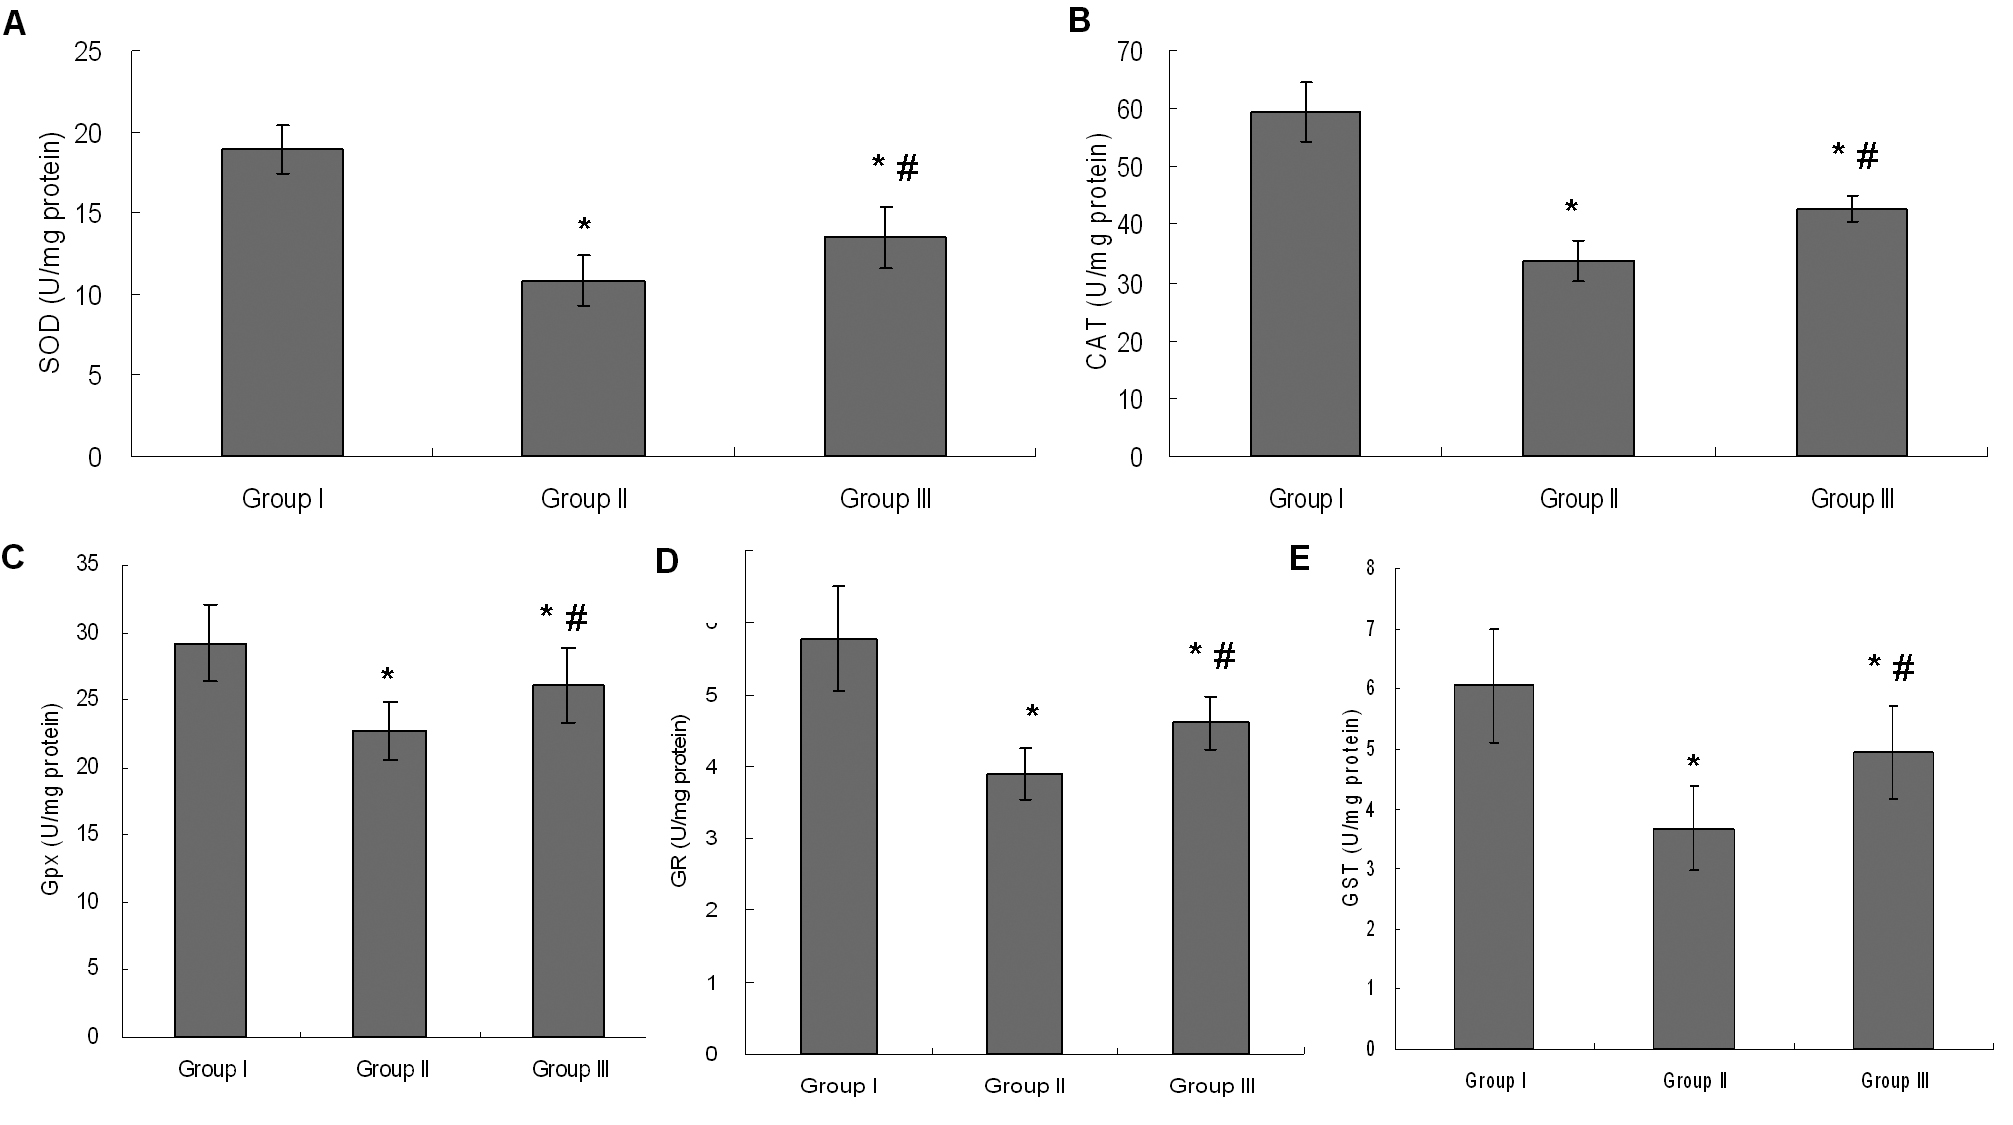
 Figure 3
of Qi, Mol Vis 2012; 18:151-160.
Figure 3
of Qi, Mol Vis 2012; 18:151-160.