Figure 2. T-AOC in the lens of experimental groups. Group I: Control. Group II: Selenite-supplemented. Group III: Selenite-supplemented
+ UDCA treated. Values are expressed as mean±SD. Statistics of the data used one-way ANOVA followed by the least significant
difference (LSD) test. * Compared with Group I: p<0.05. # Compared with Group II: p<0.05.
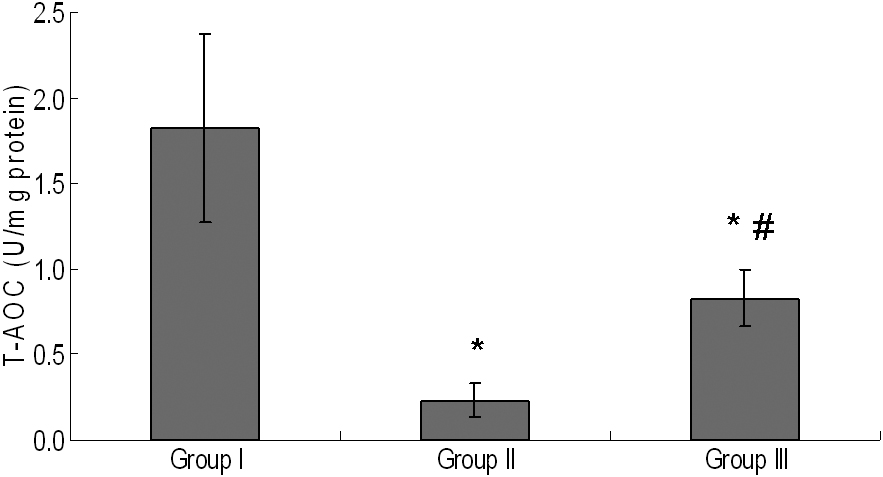
 Figure 2 of
Qi, Mol Vis 2012; 18:151-160.
Figure 2 of
Qi, Mol Vis 2012; 18:151-160.