Figure 7 of
Hazra, Mol Vis 2012; 18:1701-1711.
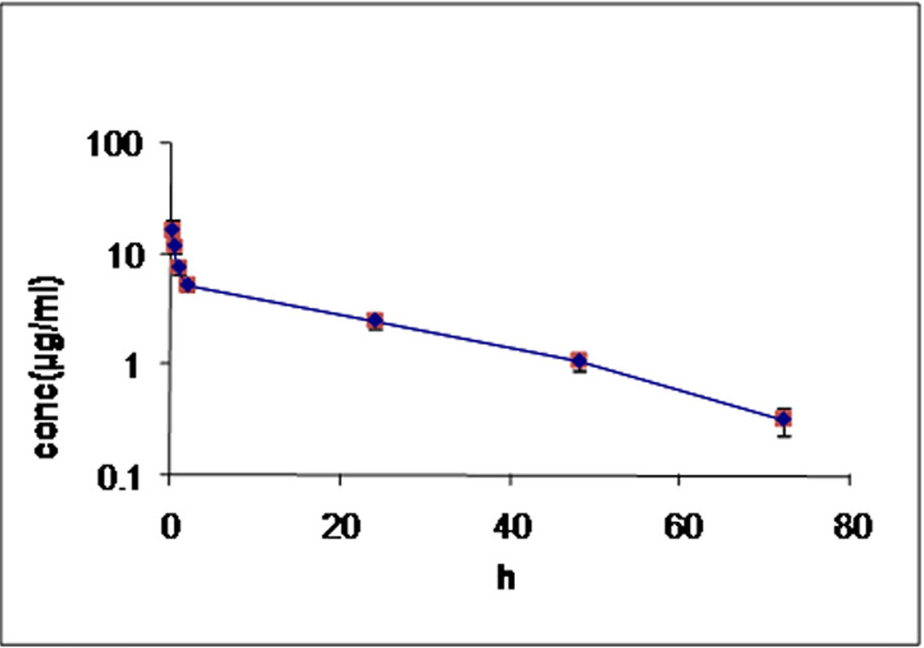
Figure 7.
Concentation of EDTA in the aqueous humor after an intraocular injection of 5 mg of EDTA. The concentration of EDTA in the aqueous humor is plotted on the ordinate and time on the abscissa. Data are the means±SEM (n=3).
 Figure 7 of
Hazra, Mol Vis 2012; 18:1701-1711.
Figure 7 of
Hazra, Mol Vis 2012; 18:1701-1711.