Figure 7. Histopathology of optic
nerve atrophy. Relative to the normal optic nerves of
contralateral control eyes that received scAAV-GFP (A,
B), the hallmark optic nerve atrophy of LHON was
prominent in mouse eyes injected with MTS scAAV mutant ND4
that appeared thinner than the contralateral experimental eyes (C,
D). E: A scatterplot with quantile boxes shows
quantitation of the optic nerve head areas of COX8 MTS delivered
mutant (G11778A) ND4 were smaller than those of controls
injected with scAAV-GFP. The lowest line of the quantile
plot represents the tenth percentile and the highest line the
90th percentile. The bottom of the quantile box represents the
25th percentile and the top of the box the 75th percentile, with
the median value in the middle of the box. Median values are
slightly different from the means. F: A scatterplot with
quantile boxes shows axonal loss in MTS AAV mutant ND4
injected eyes relative to axon counts in scAAV-GFP
injected eyes. Values for nine of the mutant ND4
injected nerves were below the 25th percentile for control optic
nerves injected with scAAV-GFP.
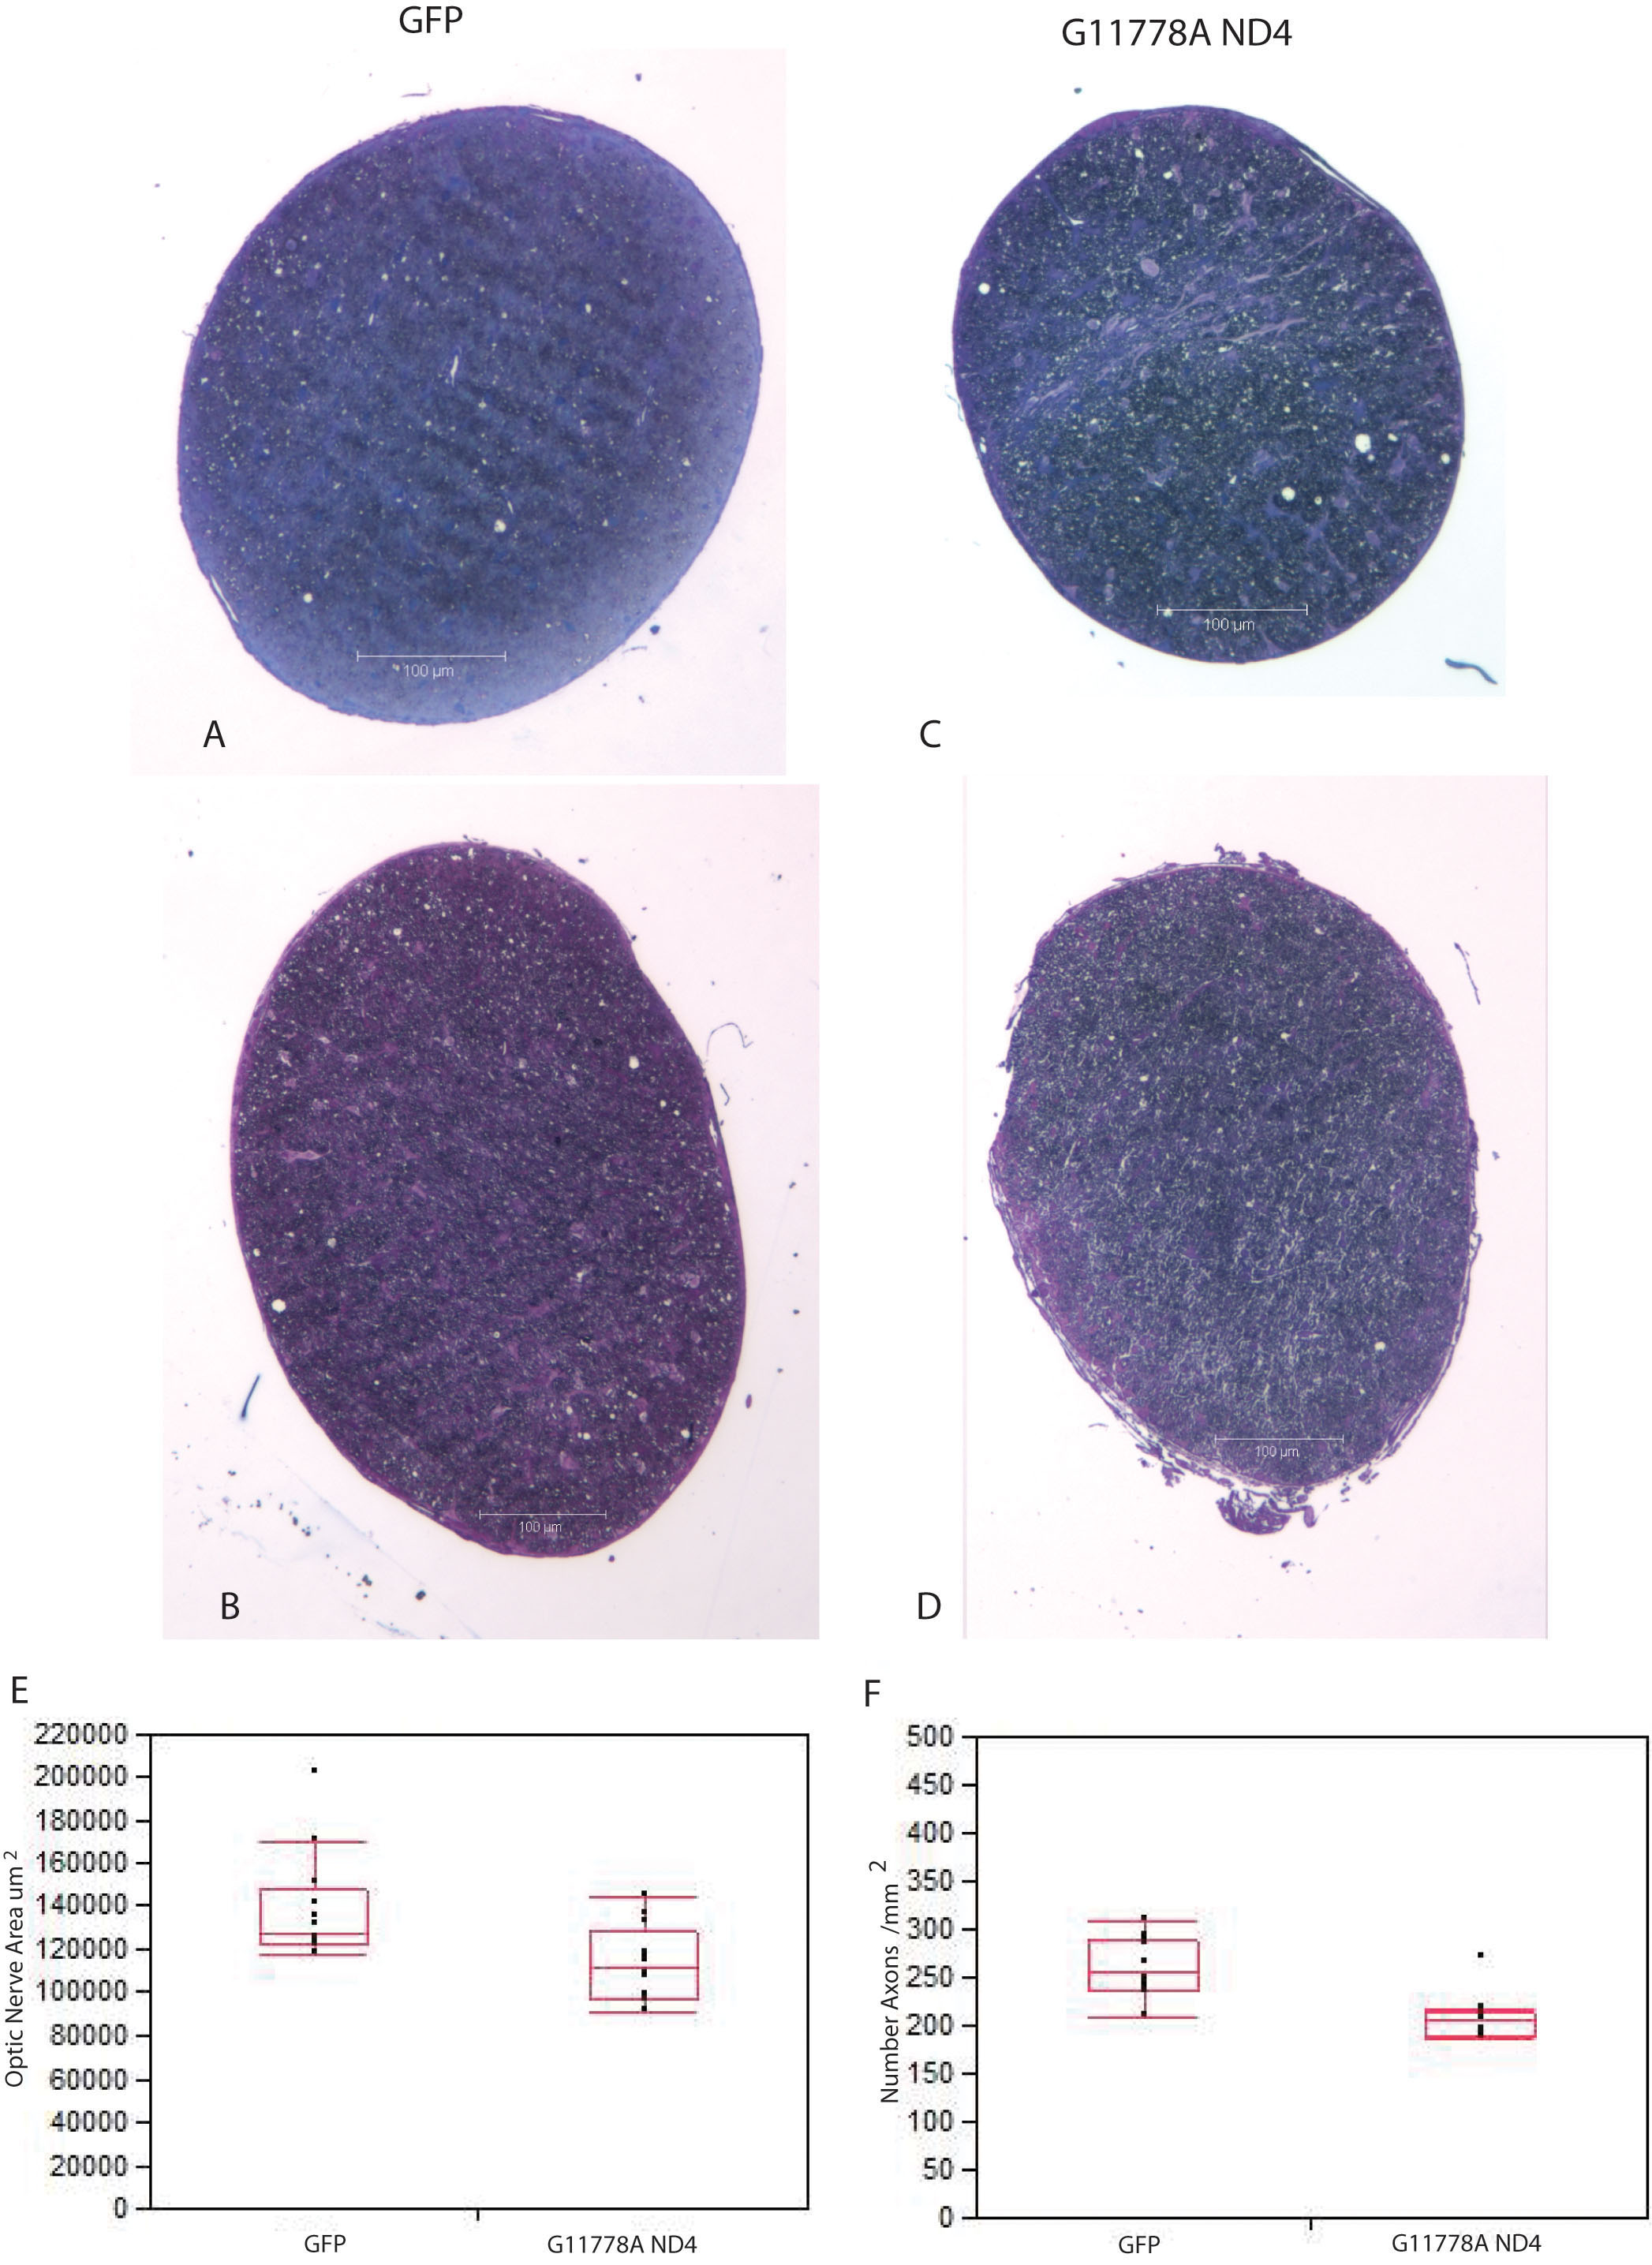
 Figure 7
of Yu, Mol Vis 2012; 18:1668-1683.
Figure 7
of Yu, Mol Vis 2012; 18:1668-1683.