Figure 4. The effects of heparanase
and vascular endothelial growth factor (VEGF) protein expression
levels on three group mice were as follows. A: It shows
the expression of heparanase in the three groups by western
blot. The band that represents the 50 kDa activated enzyme
was more intense in Group B than in Group A, and the level was
decreased by phosphomannopentaose sulfate (PI-88) treatment. B:
It shows the expression of VEGF in the three groups by western
blot. The band that represents the 50 kDa activated enzyme
was more intense in Group B than in Group A, and the level was
decreased by PI-88 treatment. C: The protein expression
level of Group B increased compared with Group A. There was a
significant difference in the heparanase expression between the
groups (p<0.0001). D: The protein expression level in
Group B increased compared with Group A. There was a significant
difference in the VEGF expression between the groups
(p<0.0001).
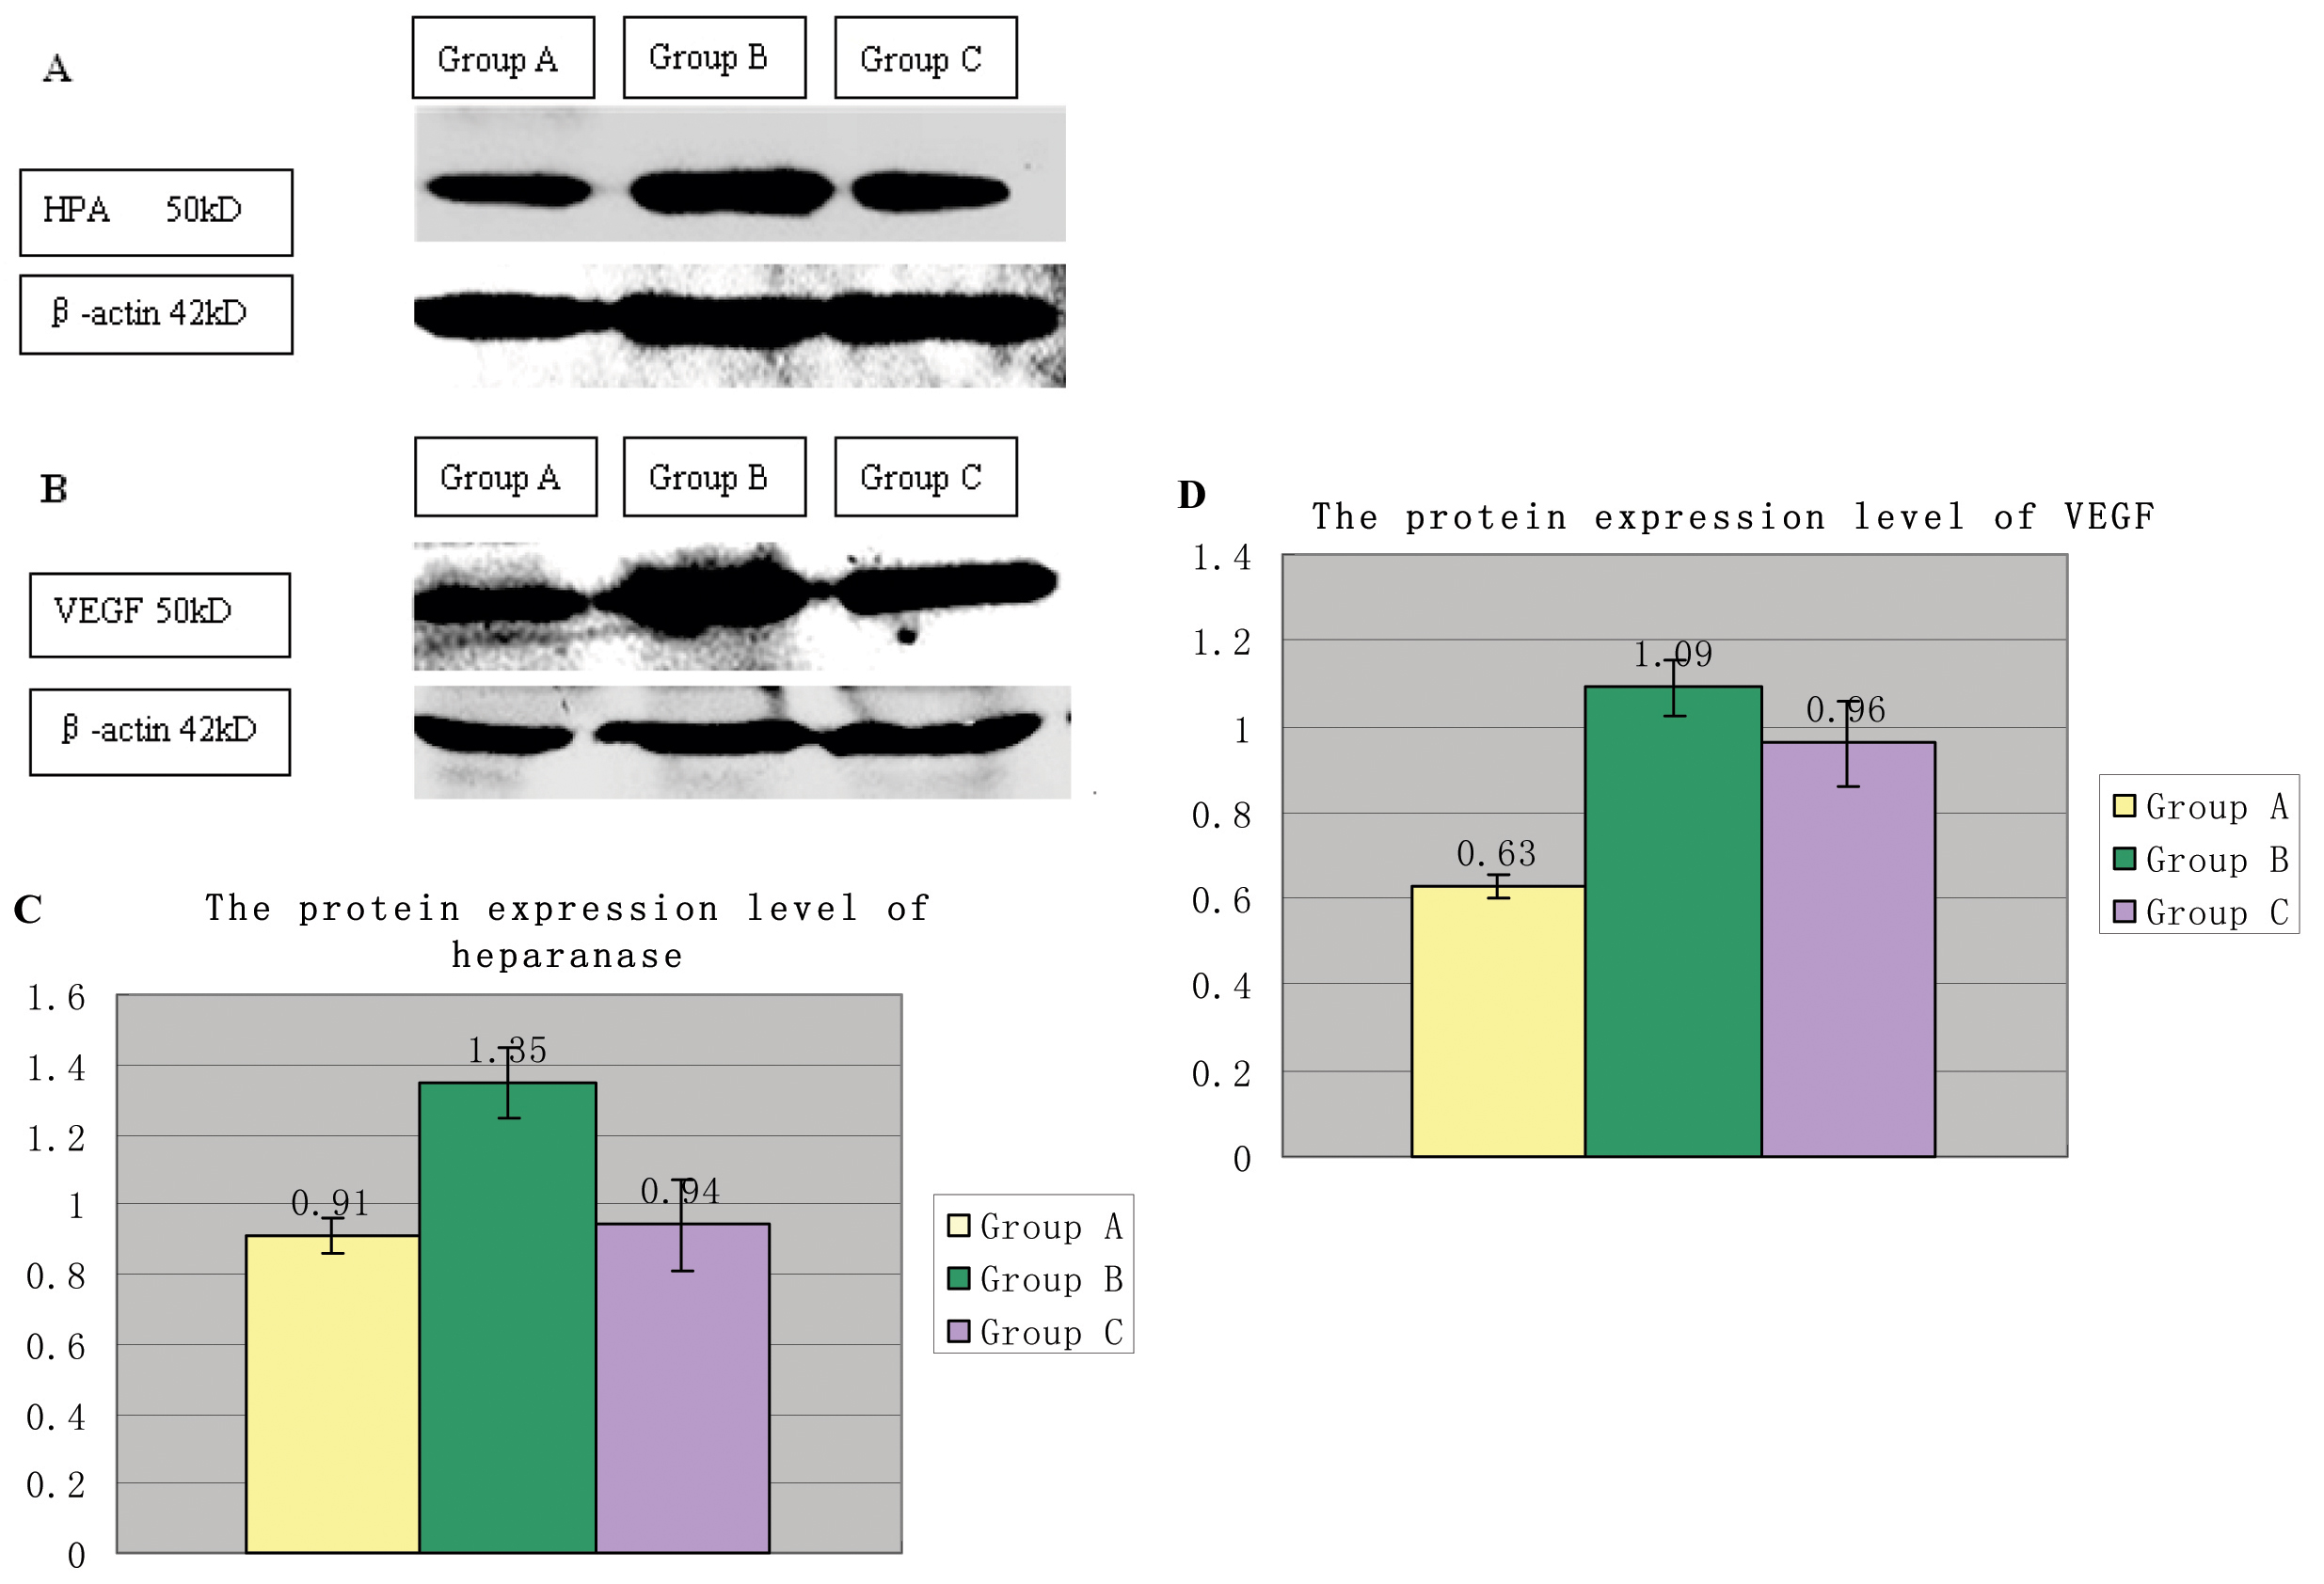
 Figure 4
of Liang, Mol Vis 2012; 18:1649-1657.
Figure 4
of Liang, Mol Vis 2012; 18:1649-1657.