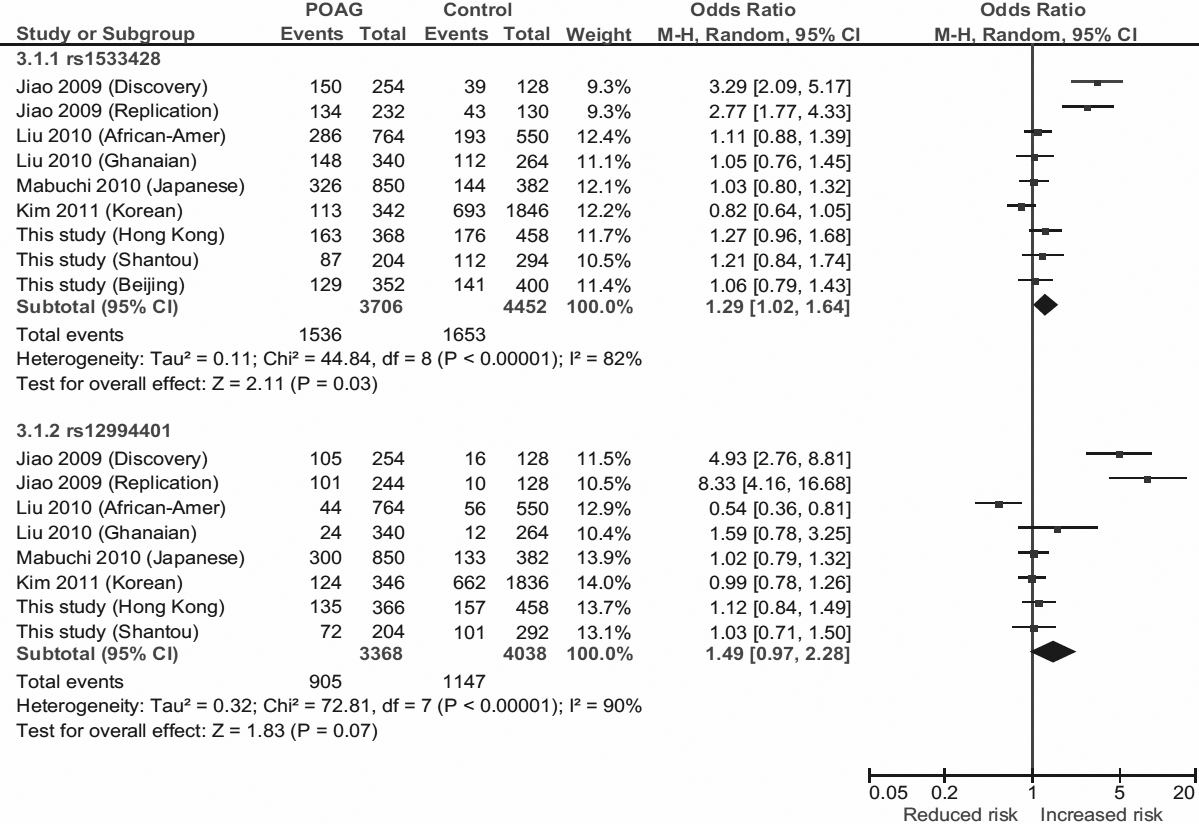
Figure 2. Allelic association of SNPs
rs1533428 [T] and
rs12994401 [T] at 2p16.3 with POAG. Squares indicate cohort-specific odds ratio (OR); the size of the box is proportional to the weight
of the study population; horizontal lines indicate 95% confidence interval (CI); diamond indicates summary OR with its corresponding
95% CI. Meta-analysis indicates significant associations of
rs1533428 (p=0.03), but not
rs12994401 (p=0.07), with POAG.
 Figure 2 of
Chen, Mol Vis 2012; 18:1629-1639.
Figure 2 of
Chen, Mol Vis 2012; 18:1629-1639.