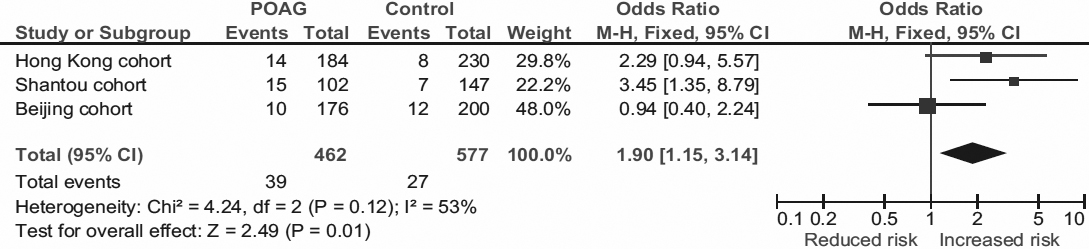
Figure 1. Association of TLR4
rs7037117 with POAG in the recessive model. Squares indicate cohort-specific odds ratio (OR); the size of the box is proportional to
the weight of the study cohort; horizontal lines indicate 95% confidence interval (CI); diamond indicates summary OR with
its corresponding 95% CI. Meta-analysis indicates a significant association between
rs7037117 and POAG.
 Figure 1 of
Chen, Mol Vis 2012; 18:1629-1639.
Figure 1 of
Chen, Mol Vis 2012; 18:1629-1639.