Figure 3. Scatter plot showing the relative expression of miRs in galactose (G1, x-axis) versus gal+pyruvate (G2, y-axis) groups: Downregulation
of miRNAs in gal+pyruvate conditions compared to gal alone is indicated by the green dots. The upregulation, if any, was not
significant.
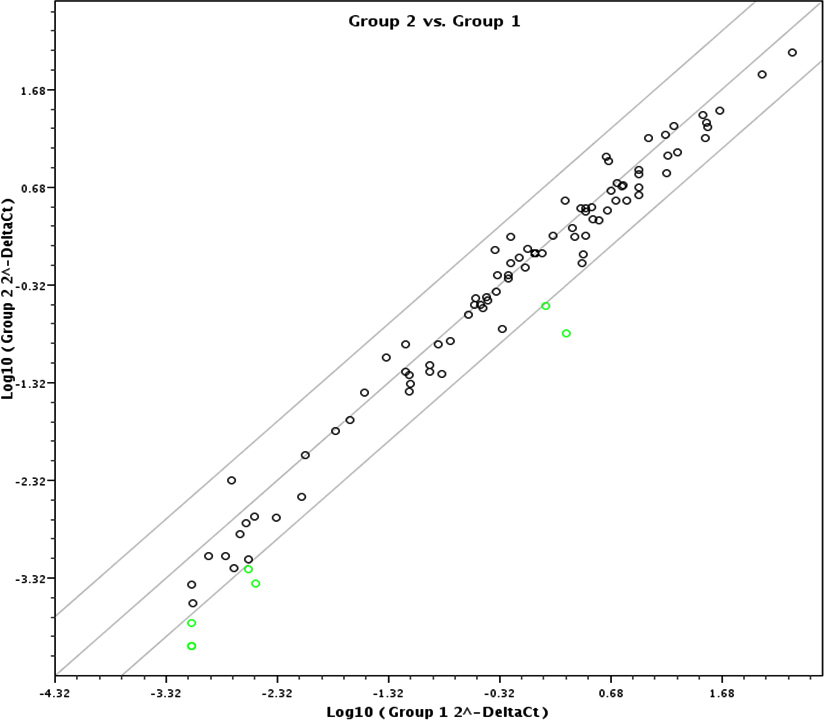
 Figure 3 of
Varma, Mol Vis 2012; 18:1609-1618.
Figure 3 of
Varma, Mol Vis 2012; 18:1609-1618.