Figure 1. The scatter plot shows the differential expression of miRs between normal and galactose mice lenses. Upregulation is indicated
by the red dots and downregulation by the green dots. Galactose-fed (Gr1, y-axis) versus normal (control, x-axis). The plot
represents the log10.2.(-ΔCt.) values of each group.
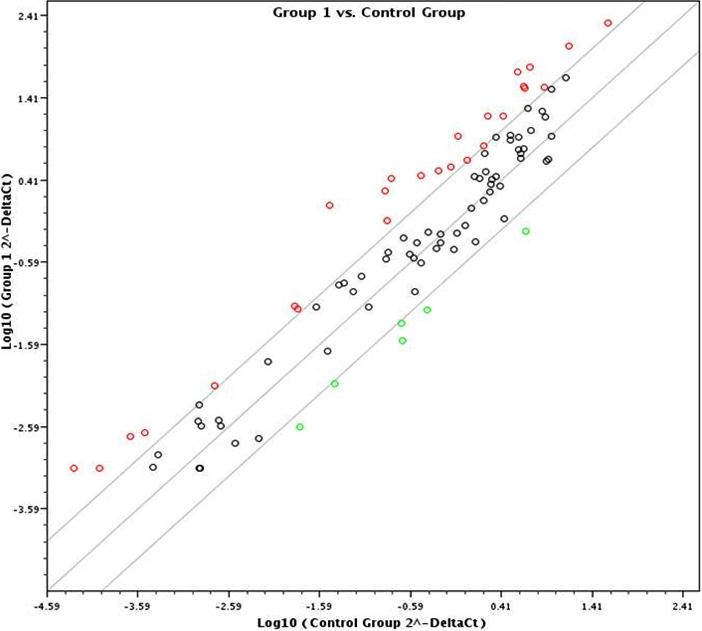
 Figure 1 of
Varma, Mol Vis 2012; 18:1609-1618.
Figure 1 of
Varma, Mol Vis 2012; 18:1609-1618.