Figure 3. Oxidative stress markers. A: Lipid peroxidation products were significantly elevated in the epithelial cells after 3 days of exposure to lower level
of organ culture medium. After 7 days of exposure, both groups (upper and lower levels) were significantly different from
the control. Statistical analysis by one-way ANOVA showed significant differences between the groups (p=0.000) and was followed
by the Bonferroni multiple comparison test (p<0.05 between the groups linked by square brackets). B: The total antioxidant capacity was found to be significantly reduced in both upper and lower levels when compared to the
control after 3 days of exposure. This tendency continued, and after 7 days of exposure, both upper and lower levels were
further reduced with respect to the control. Statistical analysis performed by one-way ANOVA showed significant differences
between the groups (p=0.000) and was followed by the Bonferroni multiple comparison test (p<0.05 between the groups linked
by square brackets).
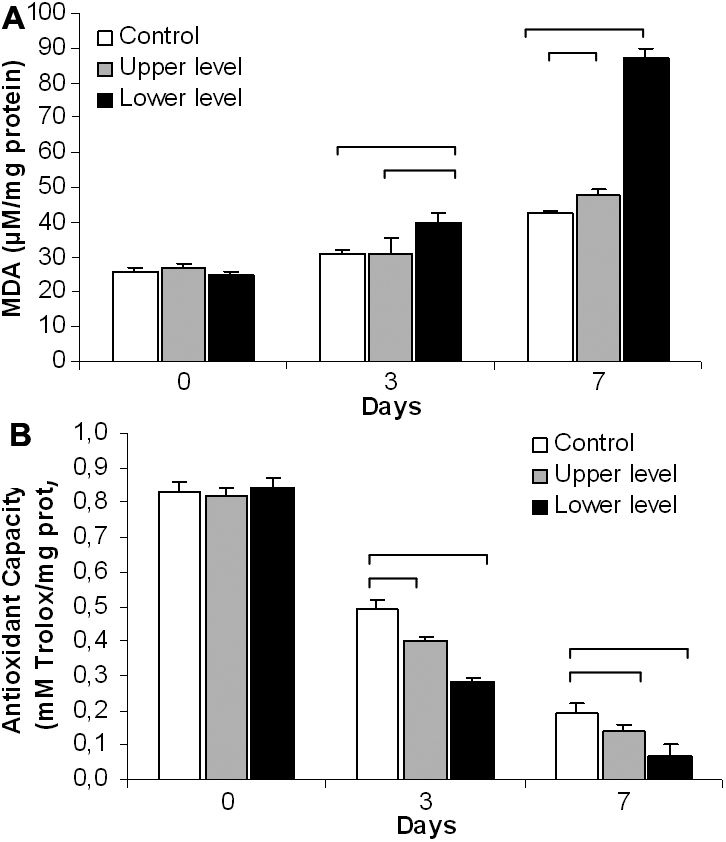
 Figure 3 of
Johnsen-Soriano, Mol Vis 2012; 18:1604-1608.
Figure 3 of
Johnsen-Soriano, Mol Vis 2012; 18:1604-1608.