Figure 4. Analysis of ARPE-19 cells after T. gondii infection by light and transmission electron microscopy. Non-infected (control; A) and infected cells after 60 (B) and 240 min (C) with thin and long extensions (arrows). Intracellular parasites (arrowhead). Electron micrograph of control ARPE-19 cells
(D) and infected with parasitophorous vacuoles containing variable numbers of T. gondii tachyzoites (T) after 60 (E) and 240 min (F). N, nucleus. Scale bars: 25 µm (A), 10 µm (B, C), 1 µm (D-F).
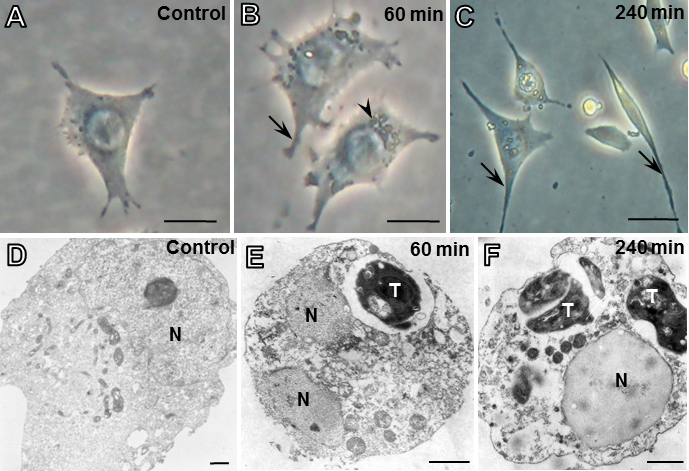
 Figure 4 of
Mimura, Mol Vis 2012; 18:1583-1593.
Figure 4 of
Mimura, Mol Vis 2012; 18:1583-1593.