Figure 3. Expression of ANXA1 in the
retinal pigment epithelium (RPE) by ultrastructural analysis.
Control group (A-C). Experimental groups: 24 h (D
and E), 48 h (F), and 72 h (G). A:
Electron micrograph of RPE localized between a vessel (V) of the
choriocapillaris and light-sensitive outer segments of the
photoreceptors (P). Marked vacuolization of the RPE (D)
is observed after intravitreal inoculation of T. gondii
compared to the control group (B). ANXA1 immunogold
labeling (arrows) in the cytosol, vacuoles and membrane of
pigment granules of RPE of control (C) and infected eyes
after 24 h (E). Also, a significant proportion of ANXA1
immunoreactivity (arrows) observed in infected eyes after 48 (F)
and 72 h (G). No labeling was detected in the control
section (H). Scale bars: 1 µm (A and D),
0.5 µm (B, C, E, F, G,
and H). Density of ANXA1 immunogold particles in RPE (I). Data are mean±SEM of 10
distinct cells analyzed from four mice per group. **p<0.01
and ***p<0.001 versus control group.
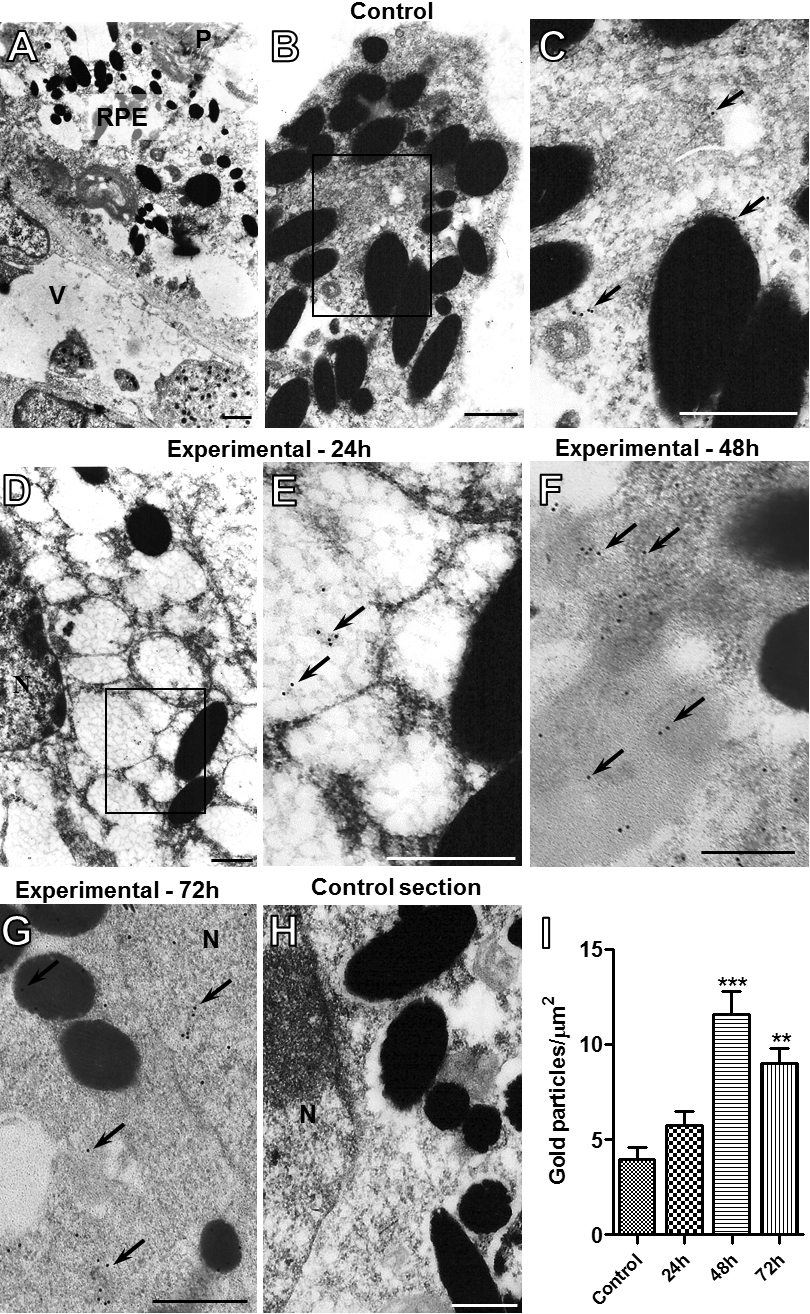
 Figure 3
of Mimura, Mol Vis 2012; 18:1583-1593.
Figure 3
of Mimura, Mol Vis 2012; 18:1583-1593.