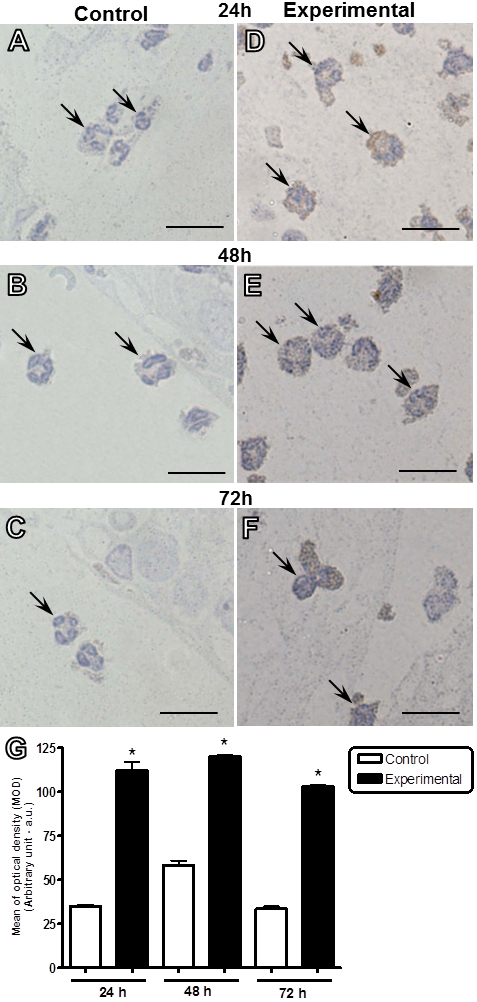
Figure 2. Expression of ANXA1 in
neutrophils after intravitreal inoculation of T. gondii.
Neutrophils (arrows) from infected eyes showed a strong
immunoreactivity for ANXA1 in the cytoplasm as compared to
control eyes after 24 (A and D), 48 (B and
E), and 72 h (C and F). Counterstain:
Hematoxylin. Scale bars: 10 µm. G: Densitometric
analysis of ANXA1 in neutrophils. Values (arbitrary units) are
expressed as the mean±SEM of sections analyzed from four
mice/group. *p<0.01 versus the respective control group.

 Figure 2
of Mimura, Mol Vis 2012; 18:1583-1593.
  Figure 2
of Mimura, Mol Vis 2012; 18:1583-1593.