Figure 4. Monitoring of normal tear samples collected during seven consecutive days (day 1-7) from 6 control volunteers (CT1-CT6). A: Virtual gel views representing tear profiles appear to be similar from the first to the seventh day in each case. B: Principal Component Analysis (PCA) of analyzed tear profiles. PCA analysis confirmed that there is no significant variation
of tear profiles from the same individual, and revealed outlier samples indicated by an arrow.
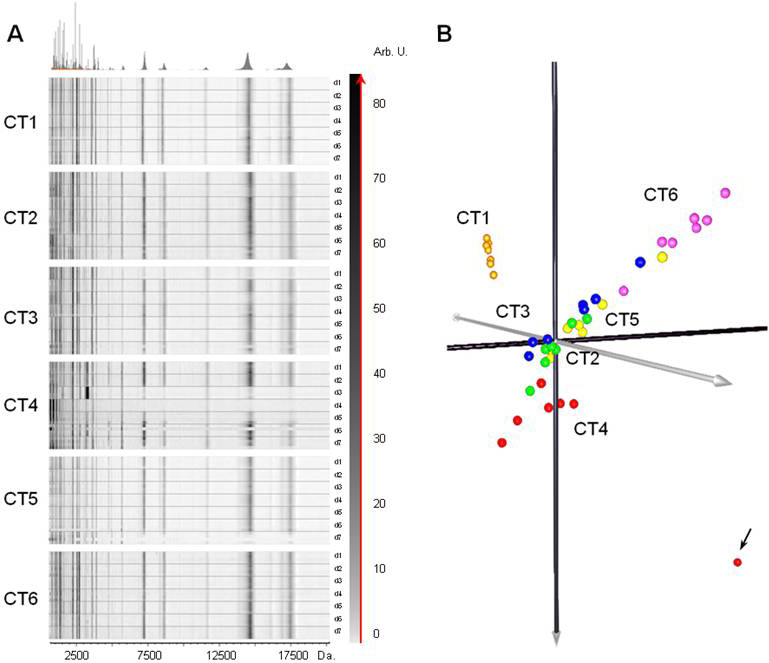
 Figure 4 of
González, Mol Vis 2012; 18:1572-1582.
Figure 4 of
González, Mol Vis 2012; 18:1572-1582.