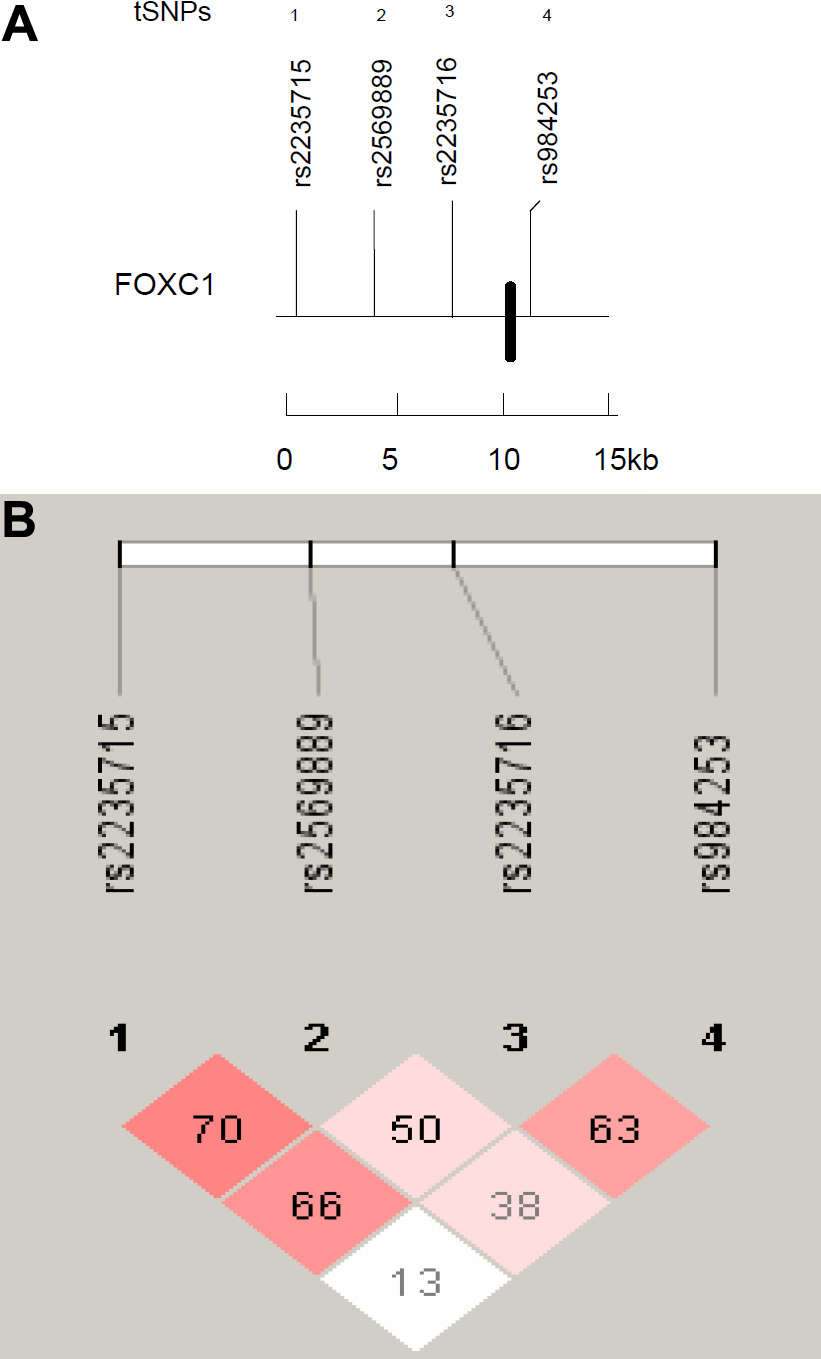
Figure 3. Linkage disequilibrium plot of
FOXC1 region
HapMap SNPs.
A: The relative position of the remaining 4 tSNPs (labeled above with the respective haplotype) spanning a region of 14,587
bp in
FOXC1 (Chr6:1543941–1558528). The coding exon is indicated as a solid box.
B: Diagram of block structure of
FOXC1 generated using
Haploview v.4.0 showing absence of common haplotype due to low LD between tSNPs. Depth of red/pink color indicates the computed pairwise
D' value; deeper pink indicates a higher
D' value.
 Figure 3 of
Park, Mol Vis 2012; 18:1526-1539.
Figure 3 of
Park, Mol Vis 2012; 18:1526-1539.