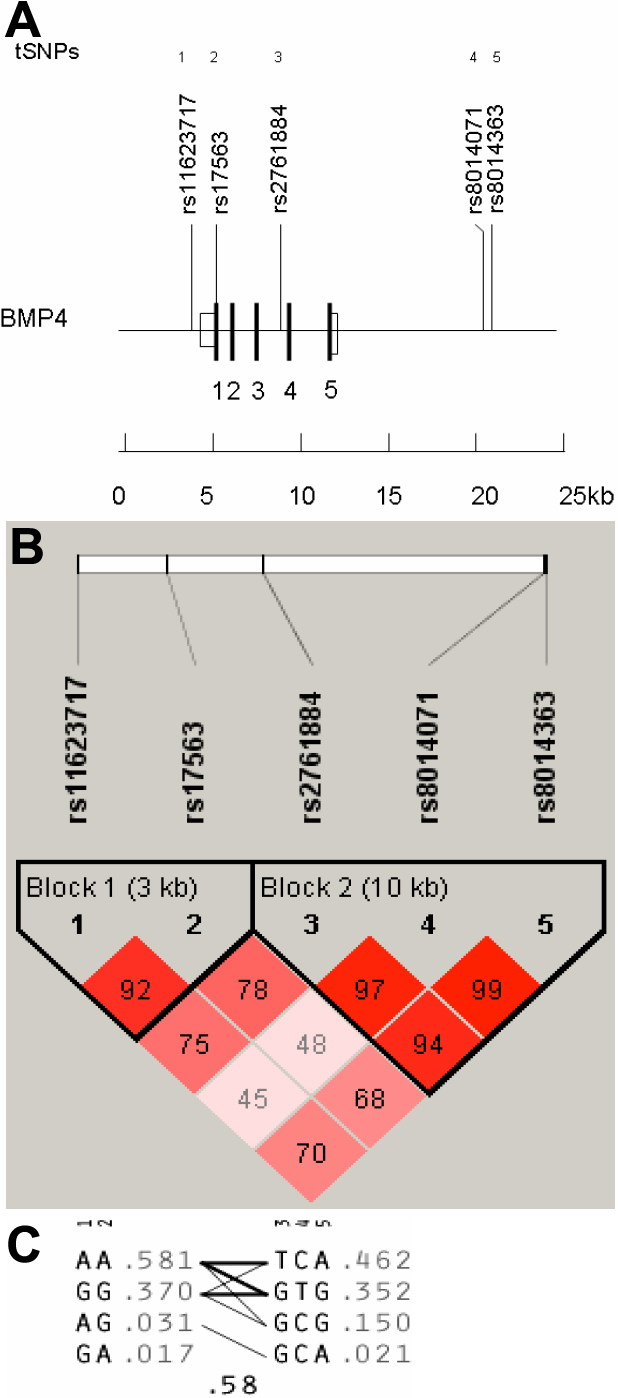
Figure 1. Linkage disequilibrium plot of
BMP4 region
HapMap SNPs.
A: The relative position of the 5 tSNPs in
BMP4 spanning a region of 17,443 bp (Chr14: 53483882–53501325). Four coding exons are indicated as solid boxes and numbered accordingly.
Untranslated exons are shown as open boxes.
B: Diagram of block structure of
BMP4 generated using
Haploview v.4.0. LD plots were identified by strong LD. Depth of red/pink color indicates the computed pairwise
D' value; deeper pink indicates a higher
D' value.
C: The selected tSNPs and estimated haplotype frequencies in the two major haplotype blocks are shown. Marker numbers and arrows
above the haplotypes indicate tSNPs. The frequency of each haplotype within a block is given to the right of the haplotype.
The thickness of the lines connecting the haplotypes across blocks represents the relative frequency (i.e., high [
thick] versus low [
thin]) with which a given haplotype is associated with the haplotype in the neighboring block.
 Figure 1 of
Park, Mol Vis 2012; 18:1526-1539.
Figure 1 of
Park, Mol Vis 2012; 18:1526-1539.